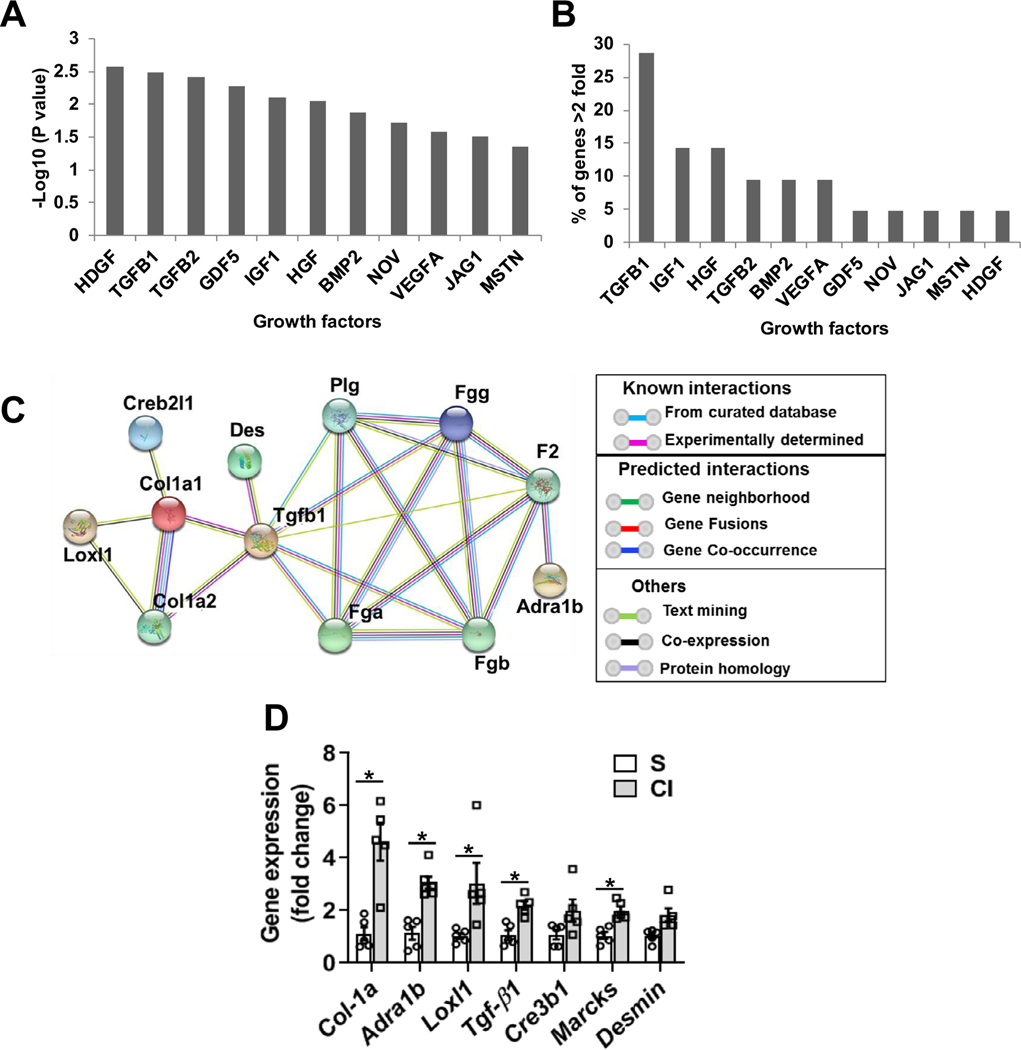
Fig 2.
Upstream regulator analysis of genes that were >2 fold up in kidneys two days after iodine contrast administration and validation. Upstream regulator analysis was performed using the Ingenuity Pathway Analysis (IPA) tool in murine kidneys two days after contrast administration compared to saline controls. (A) Upstream regulator growth factors based on −log10(P-value), (B) Percentage of genes that were upregulated by indicated growth factor. (C) Functional protein association network analysis of genes that were regulated by TGF-β1 String database (https://string-db.org/). (D) qRT-PCR analysis of selected upregulated genes found in the RNA-Seq data. ANOVA with repeated measurements was performed with post hoc Student t-test. Each bar represents mean ± SEM of 5–7 animals per group. * indicates P < 0.05.

