
Fig. 2.
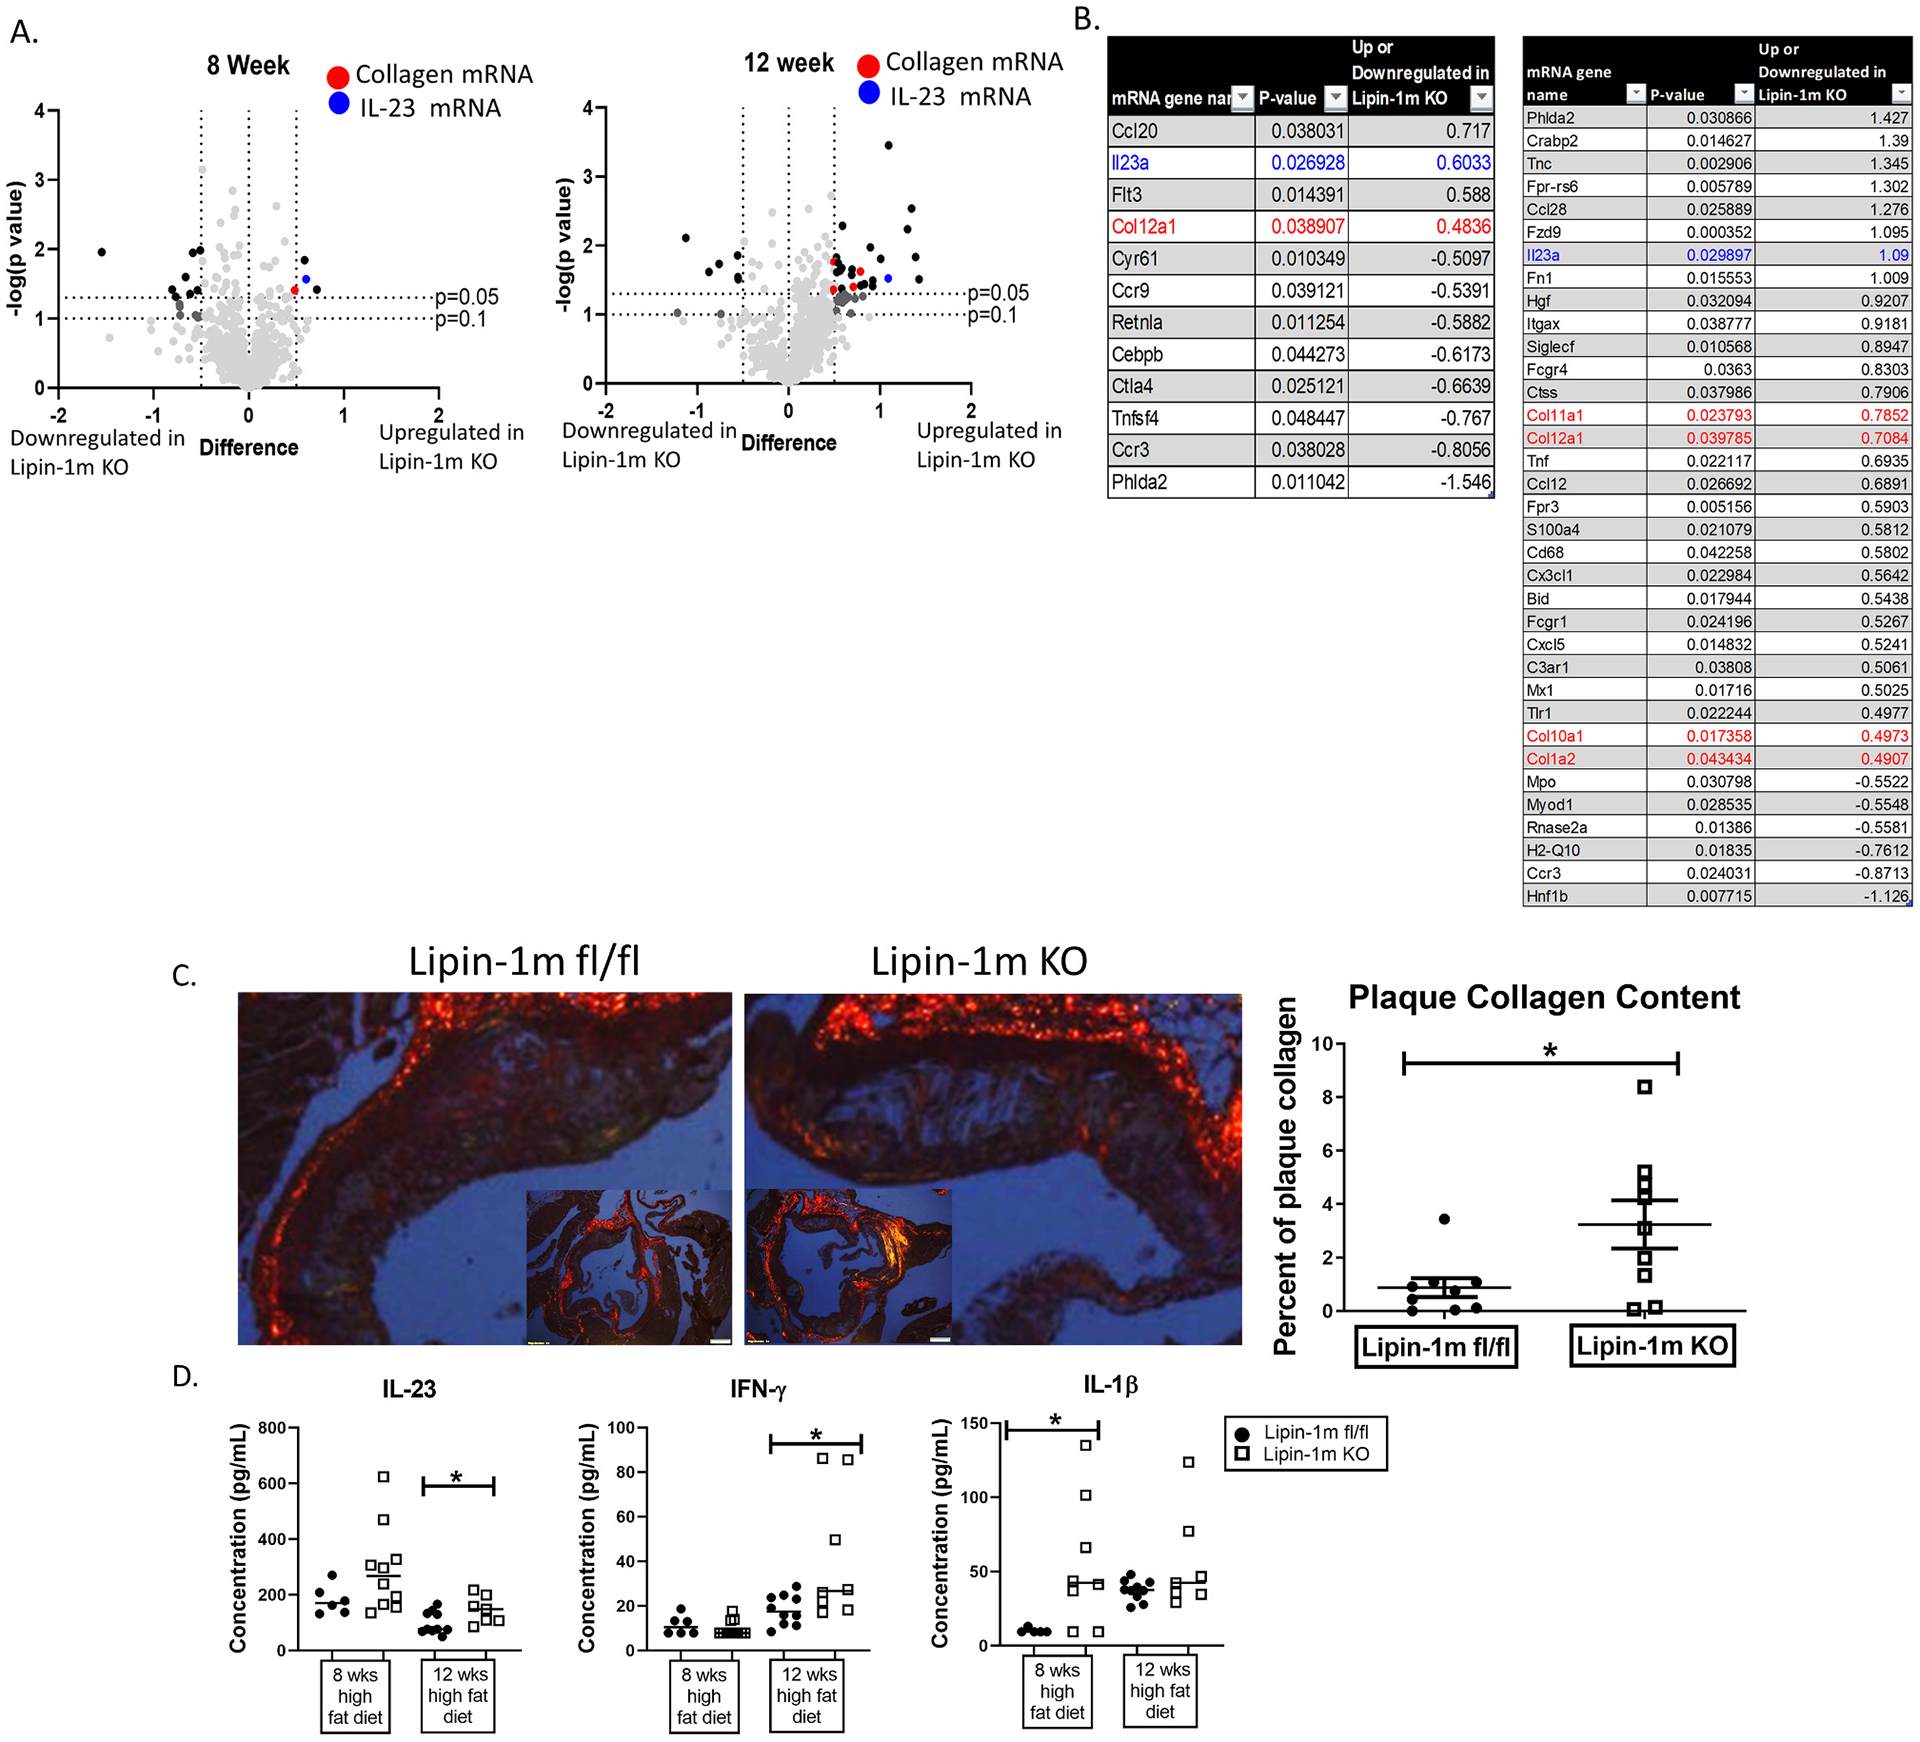
Lipin-1 regulates collagen and IL-23 gene expression.
Mice described in Fig. 1B were used. (A and B) RNA was extracted from aortic roots and Nanostring gene expression analysis was performed. Up and downregulated genes for the lipin-1mKO mice are displayed. (A) All genes plotted, (B) genes that are significantly up or downregulated 0.5 fold or more in the lipin-1mKO mice. (C) Aortic root tissue sections were stained with picrosirus red and analyzed for collagen deposition within the plaques. (D) After euthanasia, serum was collected mice. Cytokines were measured via cytometric bead array. N = 6–10 mice. *p < 0.5 Student t-test analysis was used for statistical analysis between wild type and lipin-1mKO at each time point.