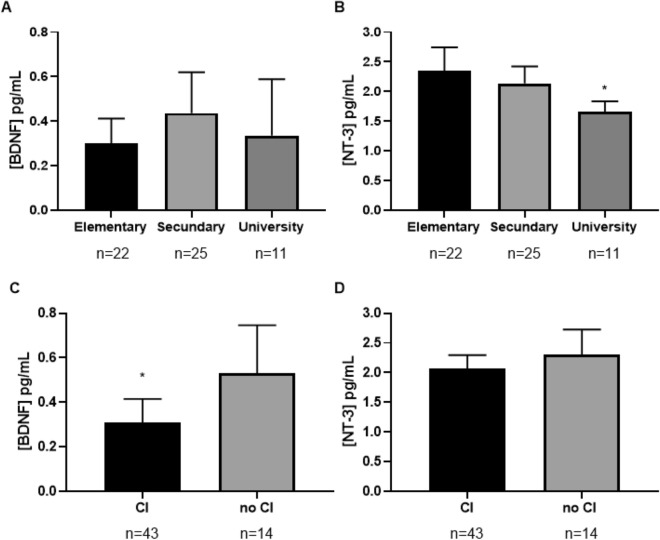
Figure 2.
Plasma concentrations of either, BDNF or NT-3 in the sample according to education level and cognitive impairment evaluated using a two-way ANCOVA with "educational level" as a factor and "age" and "BMI” as covariates. Figure (A) shows that BDNF concentrations were not influenced by educational level. Figure (B) shows statistically significant differences in 3-NT concentrations between primary and university education levels. Figure (C) shows statistically significant differences in BDNF concentrations between patients with and without cognitive impairment. Figure (D) shows that NT-3 concentrations were not influenced by cognitive impairment. The bars are estimated marginal means and 95% confidence intervals. *p < 0.05. CI cognitive impairment.

