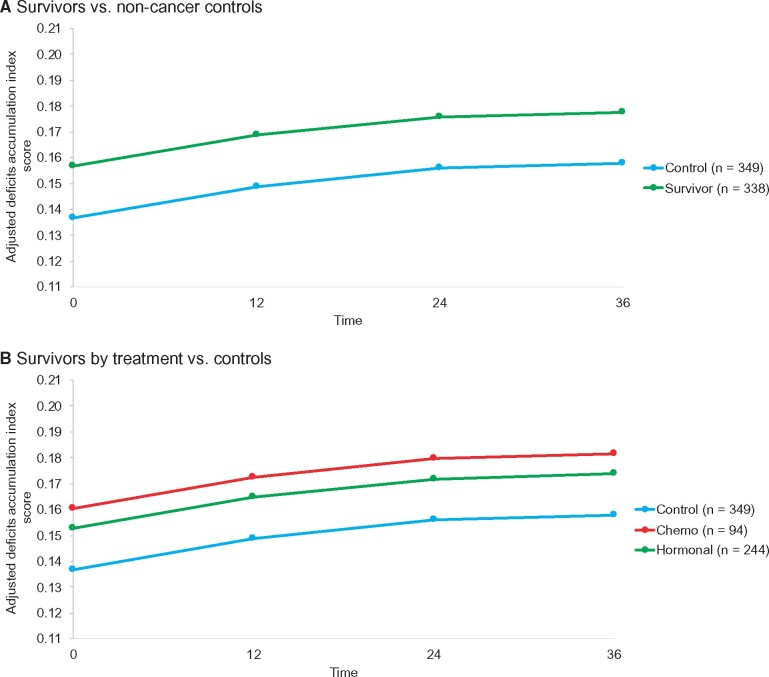
Figure 2.
Adjusted mean deficits accumulation scores for older breast cancer survivors and frequency-matched controls. A) Shows adjusted mean deficits accumulation index scores in survivors (green) and controls (blue) from mixed models using least square mean outcome values adjusted for baseline covariates (see Supplementary Tables 4 and 5, available online). B) Adjusted mean deficits accumulation index scores are shown for survivors exposed to chemotherapy with or without hormonal therapy (red), survivors exposed to hormonal therapy only (blue), and controls (green) derived from mixed models using least square mean outcome values adjusted for baseline covariates (see Supplementary Tables 4 and 5, available online). On both panels, the models used data from all women and all timepoints they contributed.

