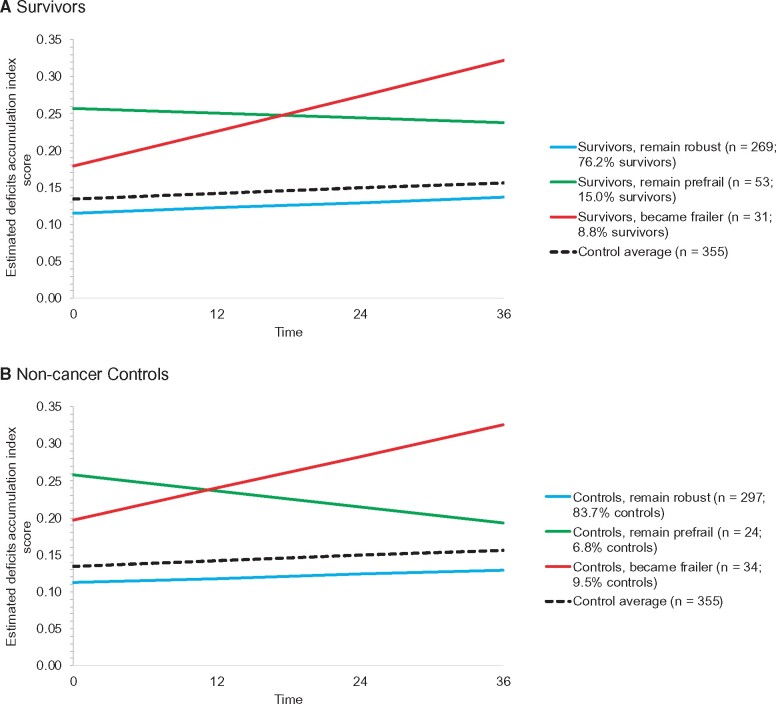
Figure 3.
Deficits accumulation index frailty trajectory groups. Deficits accumulation index scores at each assessment were used to derive trajectory groups using growth mixture models. Data were used from all women and all timepoints they contributed. The number of groups was determined by having at least 2% of participants in a group, likelihood ratio tests, the smallest Bayesian information criterion (BIC), and a priori expectation. Based on these criteria, 3 groups best fit the data for each group. The 3 trajectories were statistically significantly different from each other in both the survivor and control models, and the 3 survivor trajectory groups were statistically significantly different than the average of the overall control group (dotted black line) (all 2-sided P < .001 from growth mixture models).

