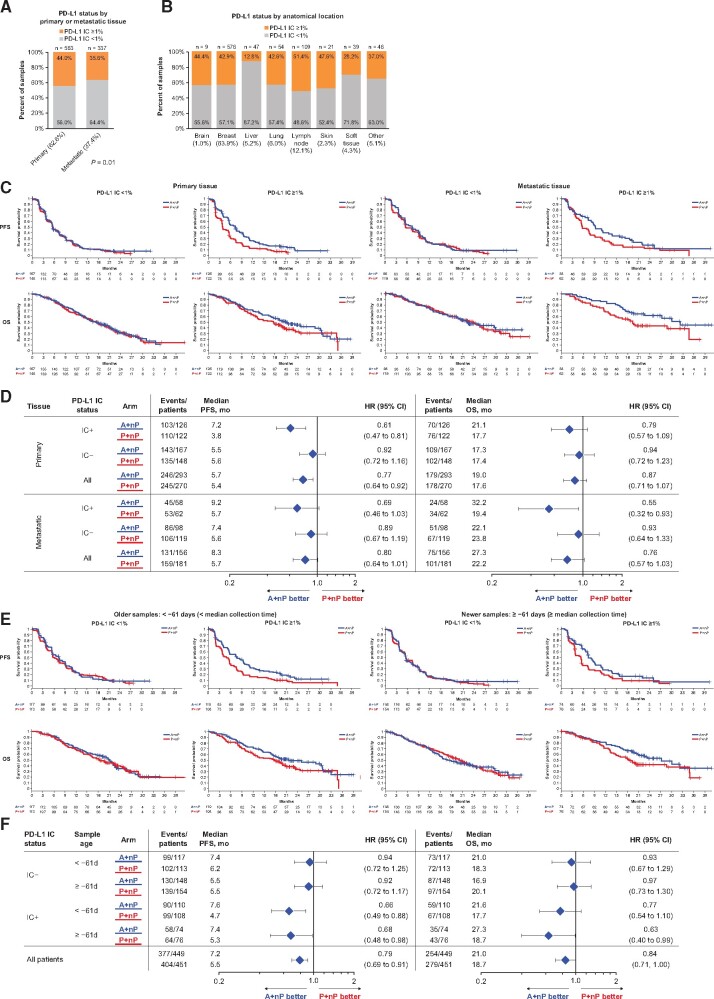
Figure 2.
PFS and OS grouped by PD-L1 IC, tissue origin, and sample collection timing. A-B) Expression of PD-L1 on IC based on primary or metastatic source and anatomical location. Kaplan-Meier plots are shown based on PD-L1 IC and (C-D) biopsy origin (primary tumor vs metastases) or (E-F) sample collection timing. A = atezolizumab; CI = confidence interval; HR = hazard ratio; IC = tumor-infiltrating immune cells; IC+ = PD-L1 ≥ 1% on IC; IC− = PD-L1 < 1% on IC; nP = nab-paclitaxel; OS = overall survival; P = placebo; PD-L1 = programmed death-ligand 1; PFS = progression-free survival.

