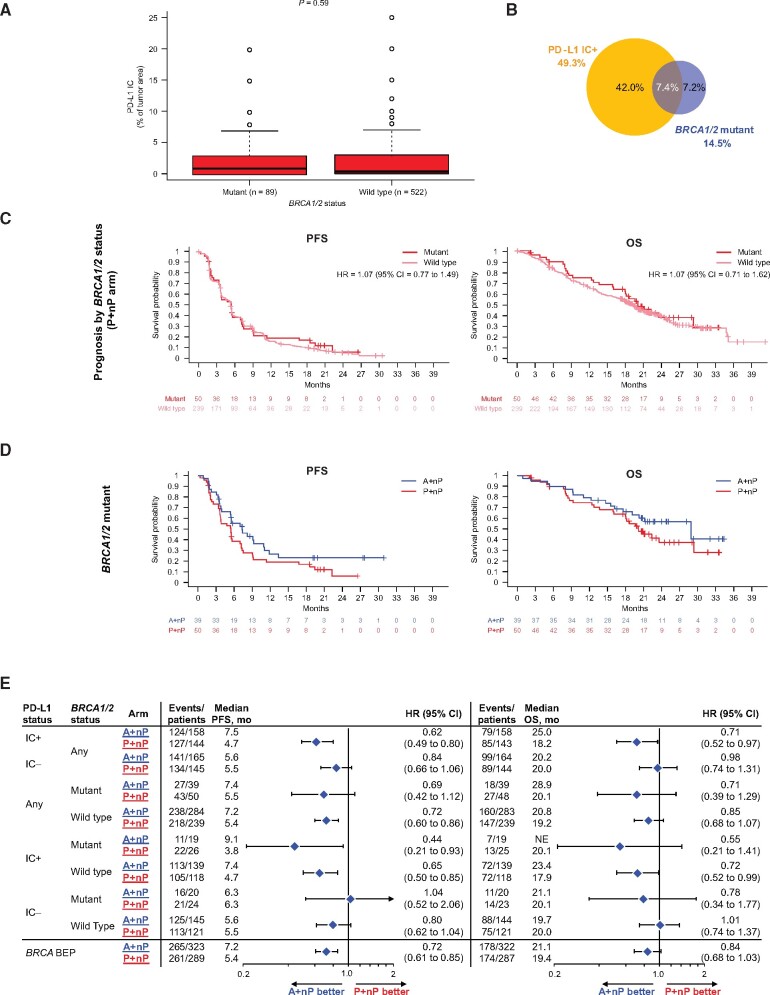
Figure 6.
Efficacy analyses in patient subgroups defined by PD-L1 on IC and deleterious BRCA1/2 mutations. A) Distribution of PD-L1 IC by BRCA mutation status. B) Prevalence of tumors with deleterious BRCA1/2 mutations and its overlap with PD-L1 IC+ cases. C) Kaplan-Meier curves for PFS and OS by BRCA1/2 mutation status in patients treated with P+nP. D) PFS and OS Kaplan-Meier curves for patients bearing tumors with BRCA1/2 mutations treated with A+nP or P+nP. E) Forest plots of PFS and OS by BRCA1/2 mutation status and PD-L1 IC-defined patient subgroups. Analyses were adjusted for prior taxane treatment and liver metastases. All P values are for descriptive purposes only. A = atezolizumab; BEP = biomarker-evaluable population; CI = confidence interval; HR = hazard ratio; IC = tumor-infiltrating immune cells; IC+ = PD-L1 ≥ 1% on IC; IC− = PD-L1 < 1% on IC; IQR = interquartile range; NE = not evaluable; nP = nab-paclitaxel; OS = overall survival; P = placebo; PD-L1 = programmed death-ligand 1; PFS = progression-free survival; r = Spearman correlation index.

