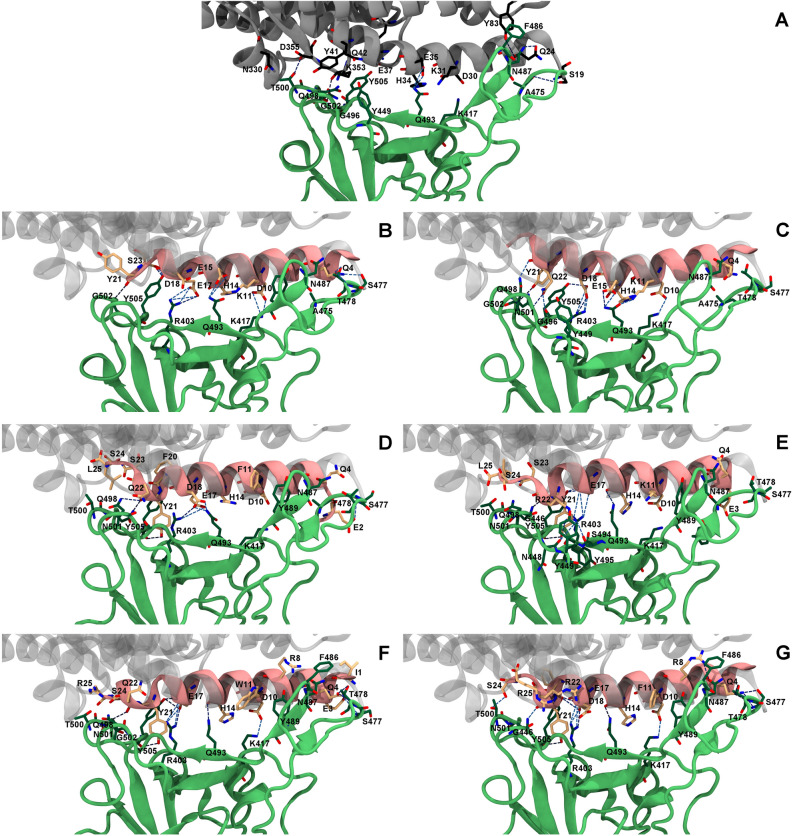
Figure 4.
Key binding interactions between SARS-CoV-2-RBD (green) and (A) ACE236, (B) SBP136, (C) SPB2536, (D) SPB25K11F, (E) SPB25Q22R, (F) SPB25F8R/K11W//L25R or (G) SPB25F8R/K11F/Q22R/L25R. The structures of SBP1, SPB25 and designed peptides (pink) were superimposed with ACE2 (grey). Key hydrogen bonds and salt bridges (hydrogen bond occupations > 25%) are shown in blue dashed lines. These structures are the structures closest to the average structures from the 80–100 ns MD trajectories.

