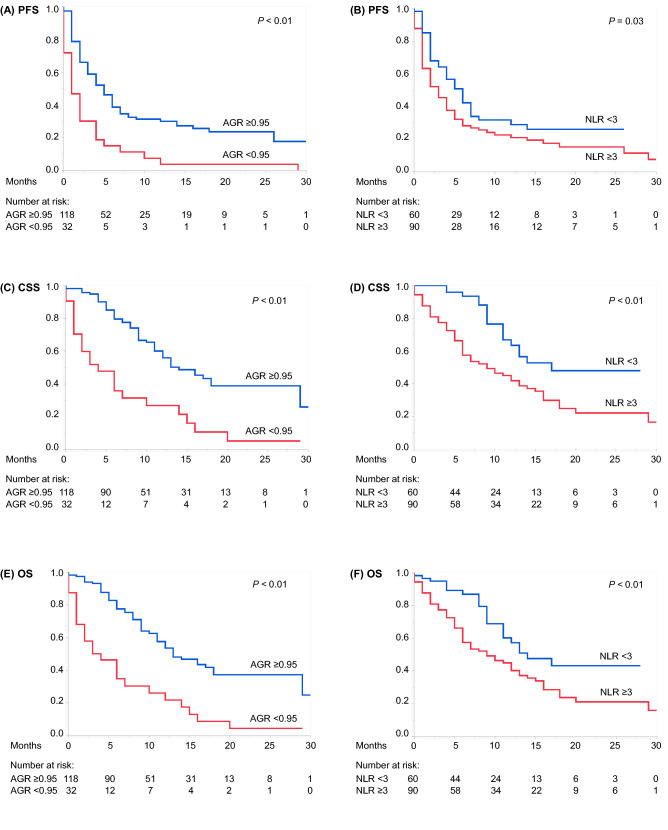
Figure 2.
Kaplan–Meier curves depicting (A) PFS of patients with AGR ≥ 0.95 vs < 0.95, (B) PFS of patients with NLR < 3 vs NLR ≥ 3, (C) CSS of patients with AGR ≥ 0.95 vs < 0.95, (D) CSS in patients with NLR < 3 versus NLR ≥ 3, (E) OS of patients with AGR ≥ 0.95 vs < 0.95, and (F) OS of patients with NLR < 3 vs NLR ≥ 3. AGR albumin-to-globulin ratio, CSS cancer-specific survival, NLR neutrophil-to-lymphocyte ratio, OS overall survival, PFS progression-free survival.

