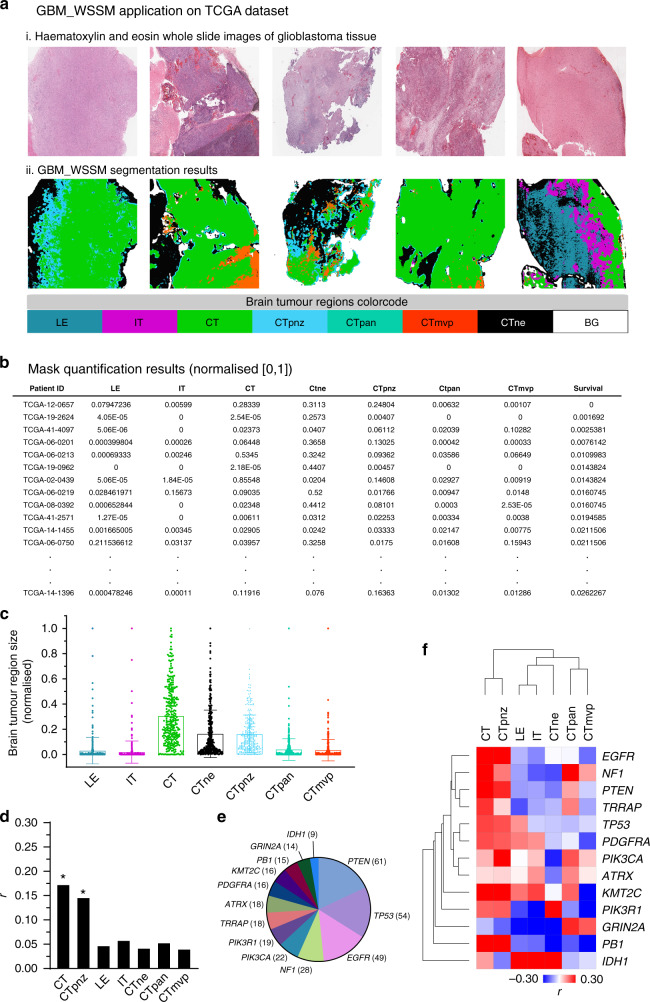
Fig. 2. The application of the GBM_WSSM model to the TCGA dataset.
a Representative results from GBM_WSSM application on the TCGA samples. (i) WSIs from TCGA. (ii) Corresponding masks produced by GBM_WSSM. b Measurement of different tumour regions (normalised) and patient survival in each TCGA glioblastoma case. c Dot plot graph of the results shown in b. d Pearson correlation values between survival rates and normalised areas corresponding to each tumour region (asterisk denotes p < 0.05). Comparable statistically significant results were obtained in the presence or absence of outliers using Spearman correlation analysis, which is less sensitive to the presence of outliers. e Distribution of glioblastoma patients harbouring specific oncogenic mutations in TCGA. f Heatmap plot of Pearson correlation values between the size of the tumour regions and survival rates.

