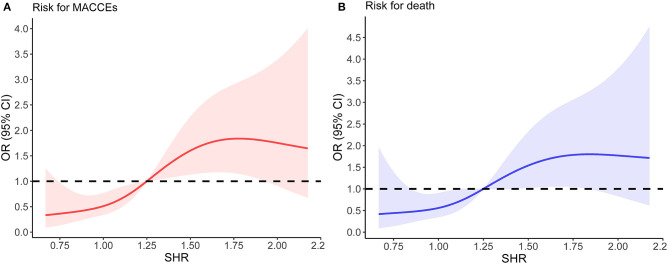
Figure 2.
The relationship between SHR and the risk of in-hospital outcomes. (A) Non-linear dose–response relationship between SHR and in-hospital MACCEs. (B) Non-linear dose–response relationship between SHR and in-hospital mortality. In (A,B), the x-axis is SHR level. The y-axis is the odds ratio, with the shaded area representing a 95% confidence interval. The threshold value of SHR (1.25) was set to 1.0 (referensce). OR, odds ratio; CI, confidence interval.

