Fig. 2.
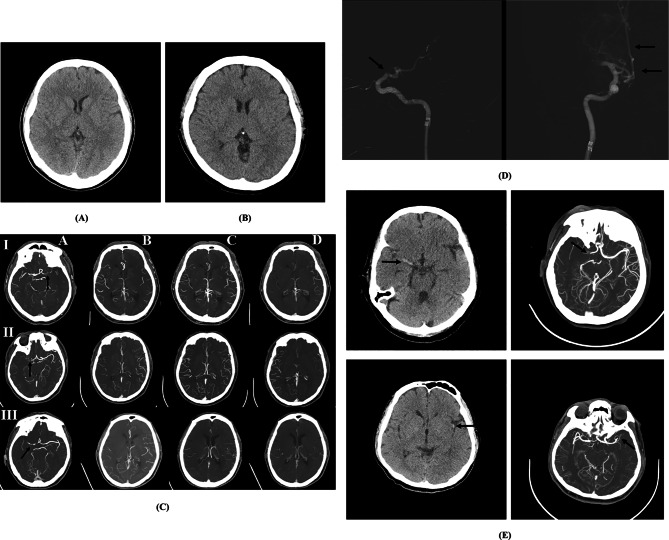
Illustrative example of NCCT and accompanying imaging examinations. NCCT images from two examinations showing two patients who had no structural abnormalities, indicating normal brain parenchyma density, normal ventricular system, and centrally located midline structures from a a Siemens and b Toshiba scanner, respectively. c Schematic of collateral circulations. Left to right (a–d) shows the site of occlusion (arrow), arterial, equilibrium venous, and late venous phase, with rows (I–III) showing good collaterals, intermediate collaterals, and poor collaterals. d A 73-year-old man with acute infarcts presented within 3 h. Pial arterial filling is moderate, with a delay of two phases indicating intermediate filling compared with the contralateral side. After administration of intravenous recombinant tissue plasminogen activator (rt-PA), the patient had no neurologic improvement, and therefore was taken for endovascular intervention. Due to the right ICA with the occlusion site around the distal cavernous to the supraclinoid segment (arrow), intra-arterial thrombectomy was performed under the impression of focal thrombus to achieve revascularization (arrows). e The top row shows NCCT obtained within 4.5 h in a 68-year-old woman with left hemiplegia that was diagnosed by a hyperdense vessel sign in the right proximal MCA (arrow). The arterial phase showed the apparent absence of a right M1 segment embolic occlusion (arrow). The bottom row shows NCCT (5-h evolution) in a 54-year-old man with right-sided weakness diagnosed with the dot sign in the left MCA territory (arrow), loss of left-sided gray–white matter differentiation, and obscuration of the left basal ganglia. The arterial phase showed a filling defect of the left proximal M2 segment thrombus occlusion (arrow)

