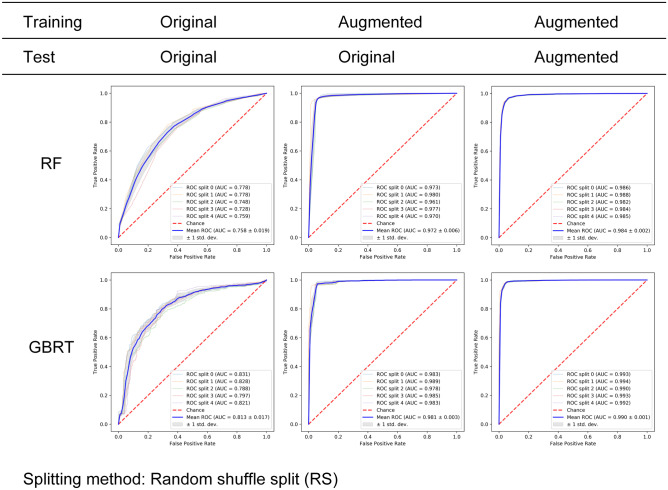
Fig. 6.
Classification results of RF (upper row) and GBRT (lower row) on three combinations of training set and test set. The RS method was used for generating the training set and test set. The table above ROC subfigures indicated the
source of training set and test set: original dataset and augmented dataset. ROC curves of five experiments were plotted (thin lines) along with the average ROC curve (thick blue line) and the standard deviation (gray area). For both RF and GBRT, training the model on augmented images (combination 2) led to significantly improved classification performance compared to training on original images (combination 1) (mean AUCs 0.758 to 0.972, 0.813 to 0.981). Training and testing on both augmented images (combination 3) further increased the AUCs

