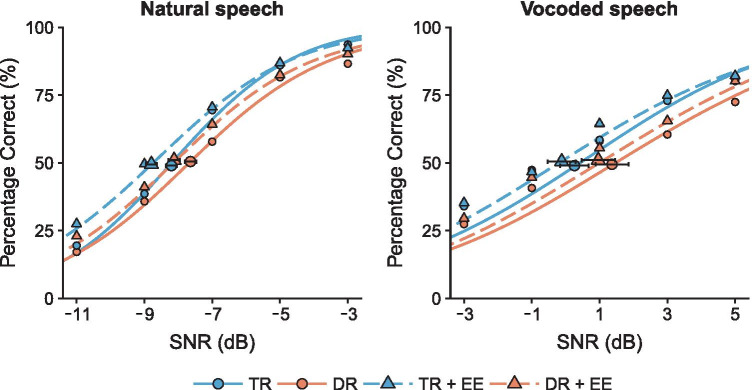
Fig. 2.
Psychometric functions fitted with a cumulative Gaussian distribution from the key word recognition scores as a function of SNR for each type of sentences. Blue circles illustrate the average key word recognition score for typical reading children (TR) and orange circles for children with dyslexia (DR) without EE, whereas blue and orange triangles indicate average performance with EE for TR and DR, respectively. Estimated speech reception thresholds are shown with their respective standard errors for each condition

