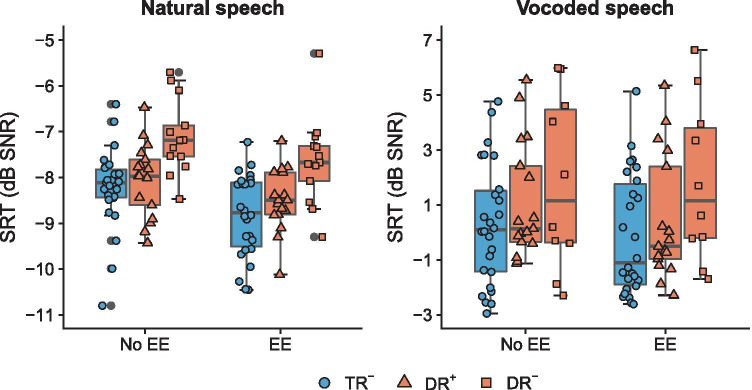
Fig. 3.
Speech-in-noise perception depicted as average SRTs for typical readers (TR−) and children with dyslexia with (DR+) and without (DR−) extensive amounts of specialized reading therapy. Individual data points in each boxplot represent individual participants, to show variation. Lines indicate the median value, and whiskers are 1.5× interquartile range

