
Table 3.
The Anti-Inflammatory Activities of Imidazole Derivatives in Multiple in vitro/ In vivo Models
| Chemical Structure | Method/Target | Activity | Reported Target | Reference |
|---|---|---|---|---|
 |
In vitro COX-1 and COX-2 enzyme inhibition assay In vivo Carrageenan-induced rat paw edema assay after 24h |
% of Inhibition COX-1 21.19 COX-2 78.68% of inhibition 54.314 |
Interacts with COX-2 enzyme | [45] |
 |
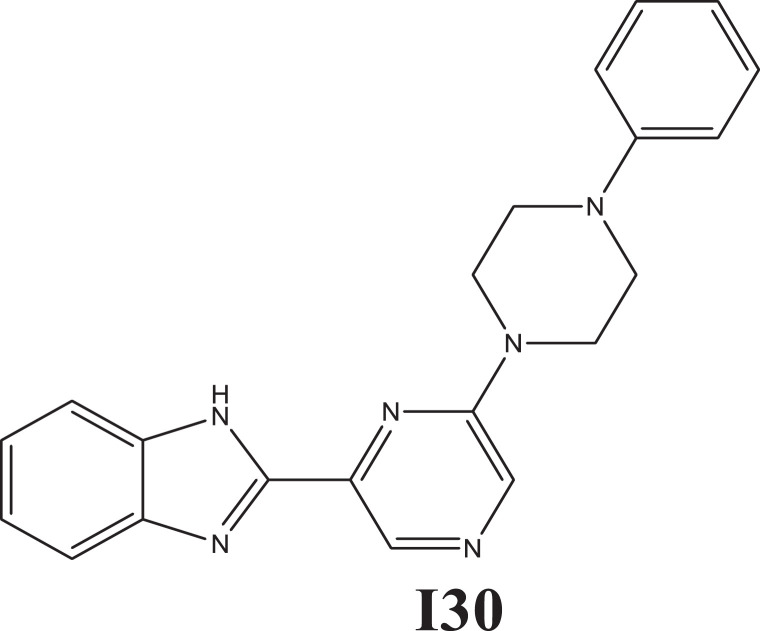
Ellman’s method-based assay |
IC50 (μM) COX-1 0.98 ± 0.97 COX-2 11.56 ± 2.42 5-LOX 09.51 ± 3.40 sPLA2-V 5.21 ± 1.12 |
COX-1,2 5-LOX, sPLA2-V Inhibition |
[50] |
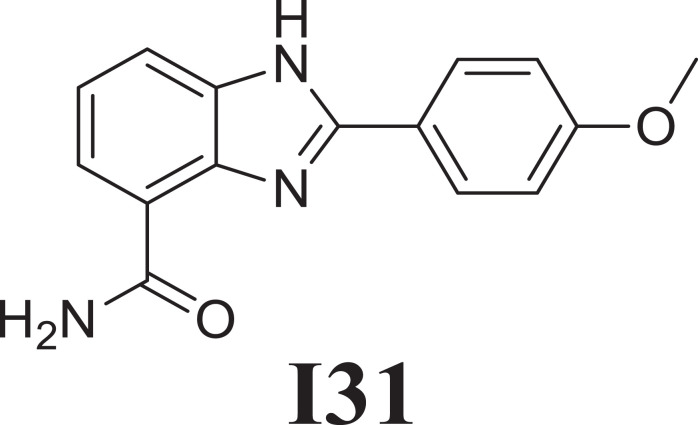
 |
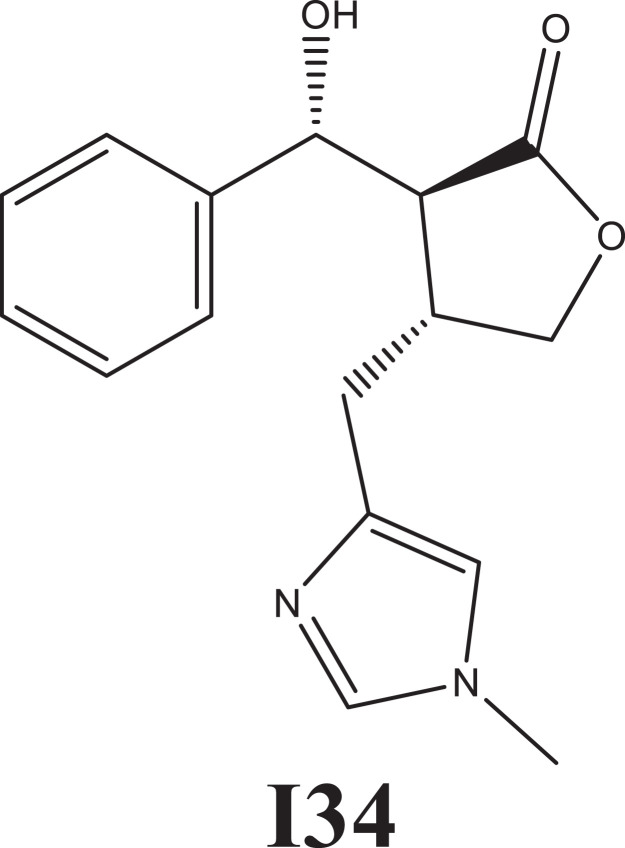
Carrageenan-induced rat paw edema assay after 6h |
% of inhibition 90.30 |
Interacts with COX-2 enzyme | [47] |
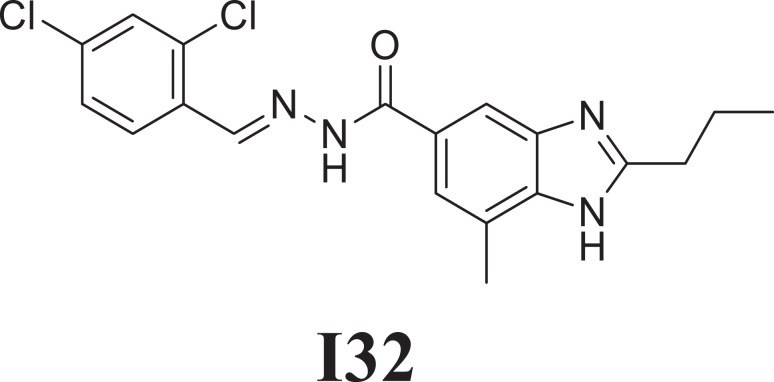
 |
Leukocyte migration |
Cytotoxicity Profile (CC10) 51±1.7 |
Reducing leukocyte migration, Cg-Induced Oxidative Stress suppressor, and formation of exudate. | [31] |
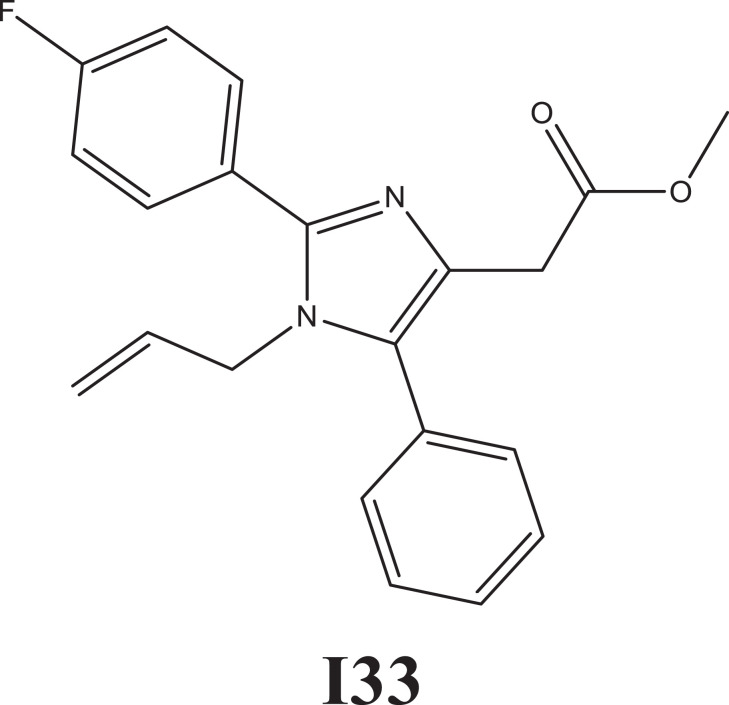
 |
MTT assay on human neutrophils |
% of inhibition MPO release 58.3 ± 3.8% ROS production 73.2 ± 0.9% IL-6 production 81.7% |
Inhibition of neutrophils degranulation and reactive oxygen species (ROS) production | [49] |
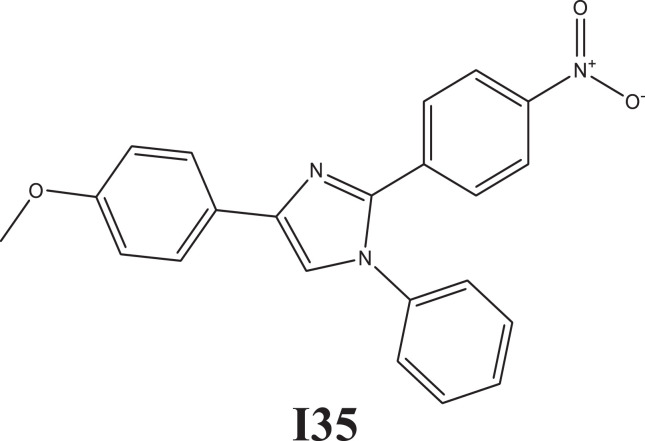 |
Carrageenan-induced rat paw edema method |
(% of inhibition) ± SEM 37.78 ± 2.377 |
ND | [35] |
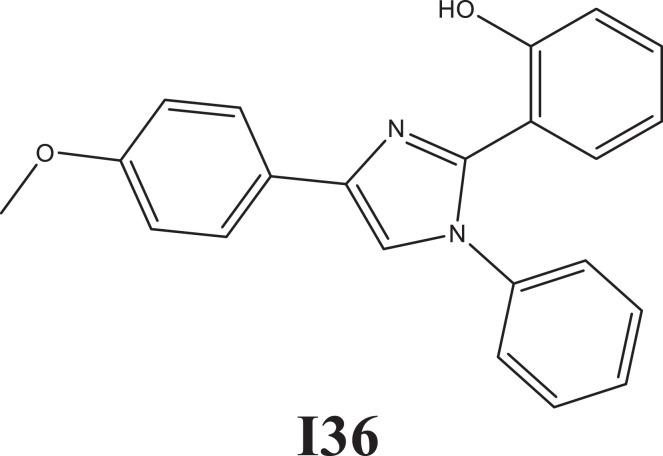 |
Carrageenan-induced rat paw edema method |
(% of inhibition) ± SEM 24.67 ± 1.213 |
ND | [35] |
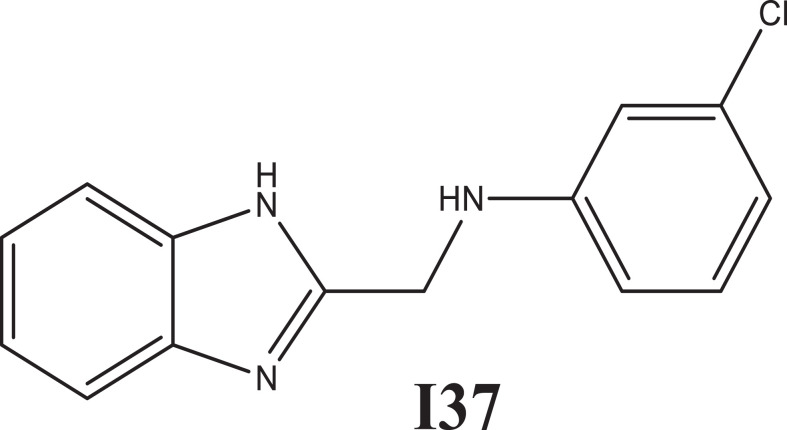 |
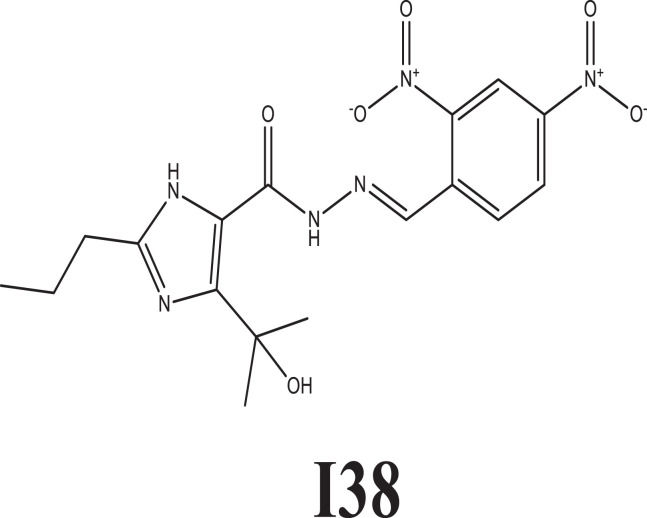
Carrageenan-induced rat paw edema method after 3h |
% of oedema inhibition 44.4 |
ND | [44] |
 |
Human erythrocyte |
IC50 (µM) 44 ± 0.17 |
ND | [46] |
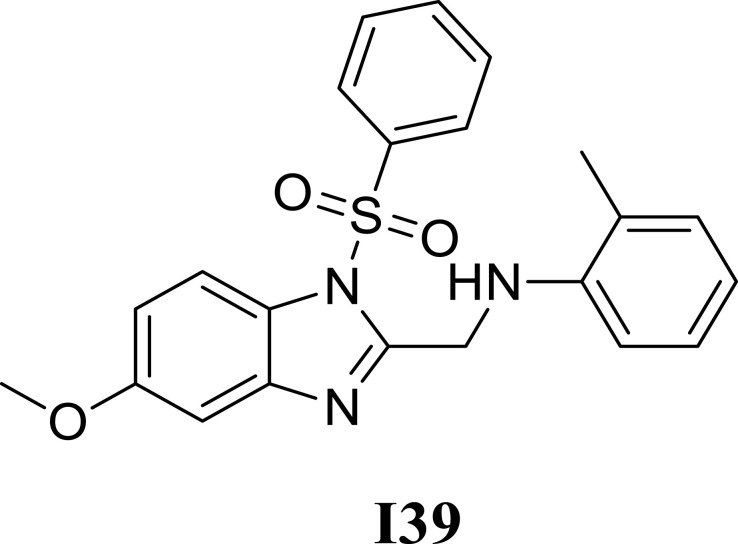 |
Carrageenan-induced rat paw edema at 3 h |
% of inhibition 53.73 |
ND | [51] |
Notes: The prefix “I” letter in the compound’s number referred to Anti-inflammatory activity. The cytotoxic concentration that killed 10% of the cells (CC10) was calculated through nonlinear regression analysis of the logarithm of concentration in the function of the normalized response (percentage of cell viability). Results are expressed as mean ± E.P.M.
Abbreviations: IC50, The concentration that inhibits enzyme activity by 50%; ND, Not determined.