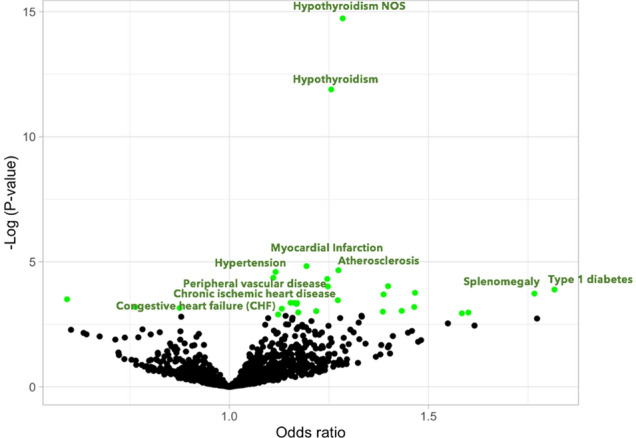
Figure 4.

Volcano plot summarizing pheWAS associations for the SH2B3 rs3184504 variant in the BioVU and eMERGE data sets. Each point indicates a phenotype association with T allele, from a logistic regression association analysis assuming an additive genetic model and are adjusted for age, gender and principal components. Odd-ratios greater than 1 indicated increased risk associated with increased kynurenine levels. Only some points are annotated for clarity, and points in green have FDR q < 0.05.
