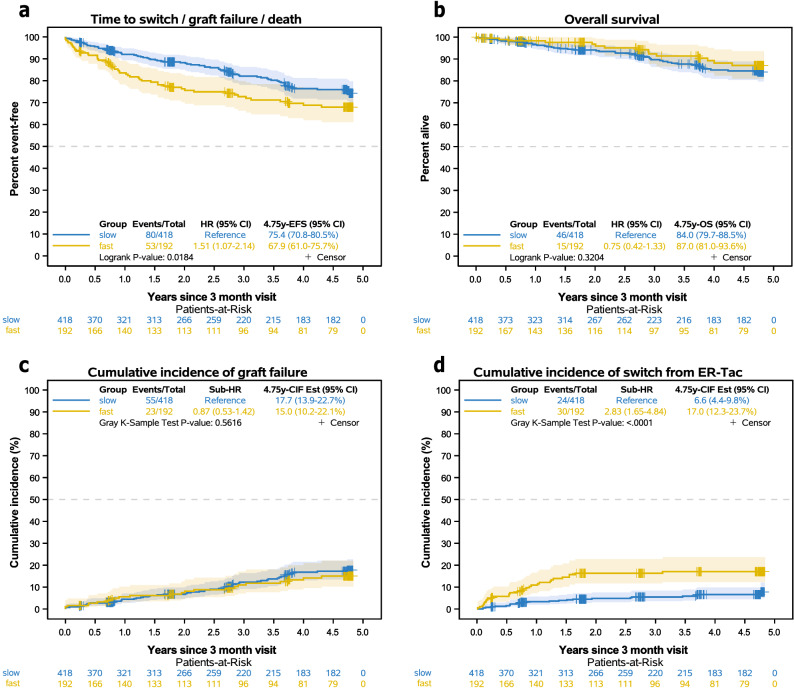
Figure 4.
Kaplan–Meier curves of the composite endpoint “switch from ER-Tac”, “graft failure”, or “death” as first event by metabolism group starting from three months after RTx (a). Overall survival is shown in (b). Cumulative incidence of the “graft failure” component (c) and “switch from ER-Tac” (c) of the composite endpoint. Since only one death without prior switch or graft failure occurred in the slow metabolism group, the curves were not drawn. The impact of fast vs. slow metabolizer was thus estimated using Fine and Gray's model leading to subdistribution hazard ratios (sub-HR) on the components of the composite endpoint. Cumulative incidence was estimated using the Aalen-Johansen estimator. Gray's k-sample test was applied to compare the cumulative incidence of the corresponding event type. The combined endpoint “switch/graft failure/death” showed more events in the fast metabolizer group. Competing risk analysis revealed that “switch from ER-Tac” occurred more frequently in fast than in slow metabolizers, but no differences were found in regards to graft failure or overall survival.

