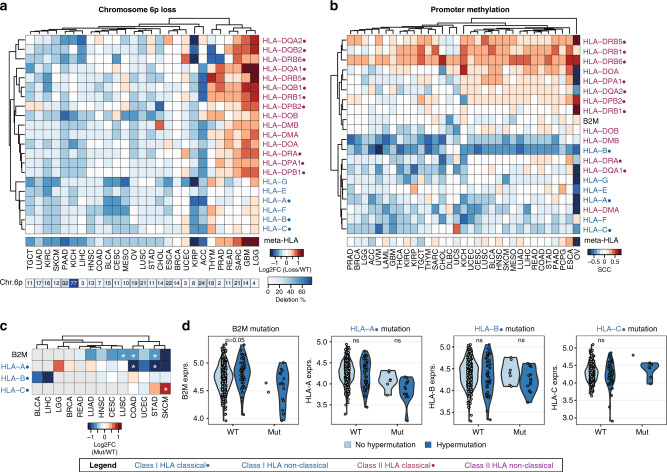
Fig. 2. Association between HLA gene expression and genomic features.
a Heatmap of the log2 fold change (log2FC) comparing HLA and B2M expression between patients with chr6p loss and patients with diploid chr6p (WT). b Heatmap of Spearman correlation coefficients (SCCs) comparing HLA/B2M promoter methylation and mRNA expression in samples with diploid chr6p. c Heatmap the log2FC comparing HLA and B2M mRNA expression between patients with and without mutations in HLA genes. Only cancer types with at least five samples displaying HLA mutations were included. Grey boxes indicate <5 samples with HLA mutations available. Stars indicate significant comparisons at p < 0.05, two-sided Student’s t-test. d Comparison of HLA gene expression in STAD between patients without (WT) and with HLA mutations (Mut). WT and Mut samples were stratified by hypermutation status (light blue = no hypermutation, dark blue = hypermutation). Significance indicated by two-sided Student’s t-tests for comparisons in which both groups had at least five samples. Classical HLA genes indicated with a dot (●), HLA class I genes indicated in blue, HLA class II genes in purple.

