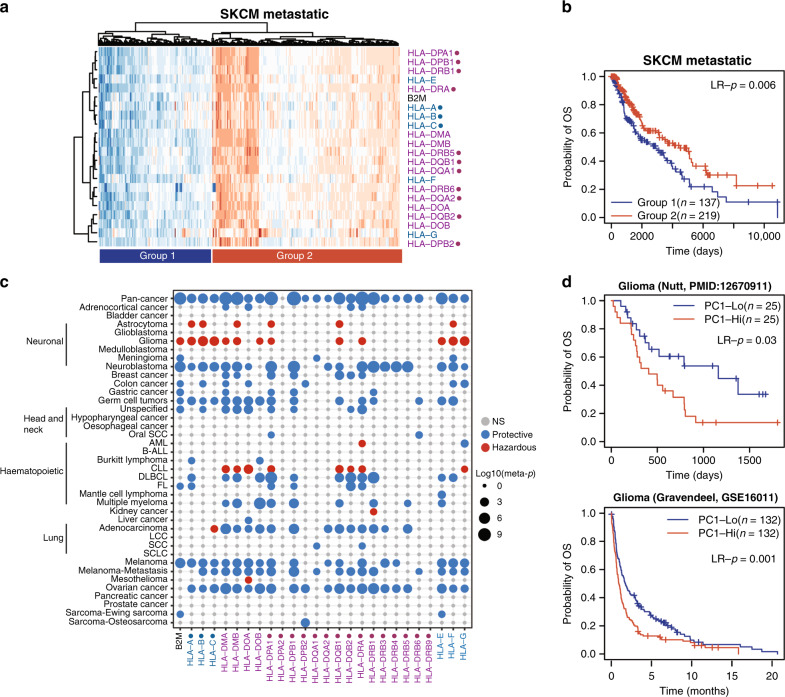
Fig. 3. HLA gene expression associated with prognosis.
a Heatmap showing clustering of metastatic melanoma patients based on HLA gene expression. b KM plot showing a difference in survival between metastatic melanoma patients in group 1 or group 2 from (a). Significance indicated by Log-rank tests. c Heatmap displaying the −log10(meta-p-value) of univariate CoxPH regression between HLA/B2M gene expression and overall survival. Blue dots indicate a protective role for HLA gene expression, whereas red dots indicate a hazardous role. Dot sizes indicate −log10(meta-p-value). d KM plot showing the difference in survival between glioma patients with low and high meta-HLA scores in two independent datasets. Significance indicated by Log-rank tests. Classical HLA genes indicated with a dot (●), HLA class I genes indicated in blue, HLA class II genes in purple.

