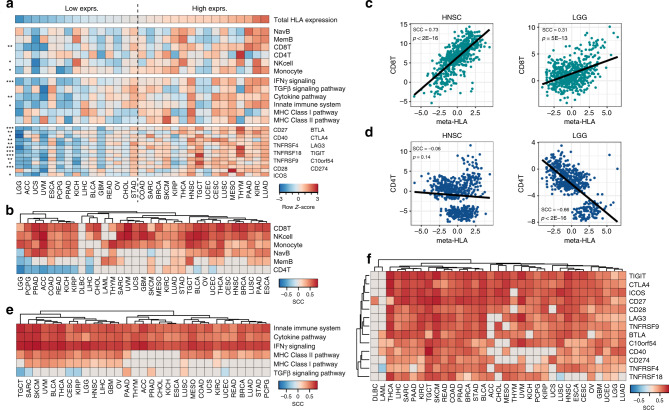
Fig. 4. Association between meta-HLA gene expression and the tumour microenvironment.
a Overview of HLA gene expression and the TME characteristics in all cancer types. Heatmap displaying z-transformed values of total HLA gene expression, immune cell infiltration, pathway activity and immune checkpoint expression. Cancer types ordered based on total HLA gene expression. Stars indicate significance between cancer types with low and high overall HLA expression (separated by dotted line) assessed by Student t-tests. *** = <0.001, ** = <0.01, * = <0.05. b Spearman correlation coefficients (SCCs) between meta-HLA gene expression and the infiltration of six major immune cell types. c Correlation between CD8+ T-cell infiltration and meta-HLA expression in HNSC and LGG. d Correlation between CD4+ T-cell infiltration and meta-HLA expression in HNSC and LGG. e SCCs between meta-HLA gene expression and the activity of six immune pathways. f SCCs between meta-HLA gene expression and the mRNA expression of immune checkpoint proteins. All non-significant correlations (Bonferroni-corrected p > 0.05) are shown in grey.

