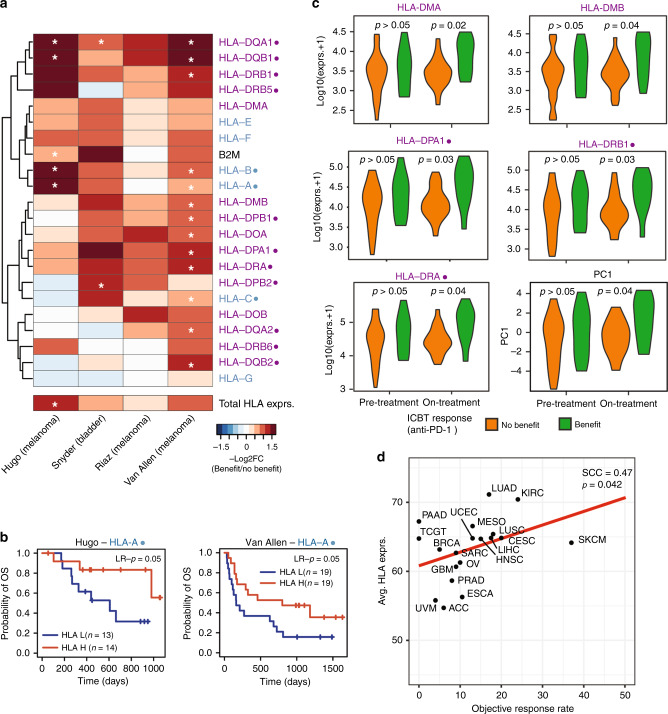
Fig. 5. HLA Class I genes associated with response to immune checkpoint blockade.
a Heatmap showing the -log10(p-values) comparing HLA gene expression in pre-treatment samples from patients with clinical benefit (complete response (CR) and partial response (PR)) to patients without the clinical benefit (progressive disease (PD)). Due to the small sample sizes, significance was indicated by a one-sided t-test hypothesising that patients with clinical benefit had higher HLA gene expression compared to patients without clinical benefit. White stars indicate significance at p < 0.05. b KM plot comparing overall survival between patients with low and high HLA-A gene expression in the Hugo and Van Allen datasets. Significance calculated by Log-rank tests. c Violin plots comparing gene expression of 5 HLA class II genes and the meta-HLA gene between patients who benefitted or did not benefit from anti-PD-1 treatment in pre- or on-treatment biopsies. Significance calculated by two-sided Student’s t-tests. d Correlation between -log10(total HLA gene expression) and ICBT objective response rate based on ref. 41 Classical HLA genes indicated with a dot (●), HLA class I genes indicated in blue, HLA class II genes in purple.

