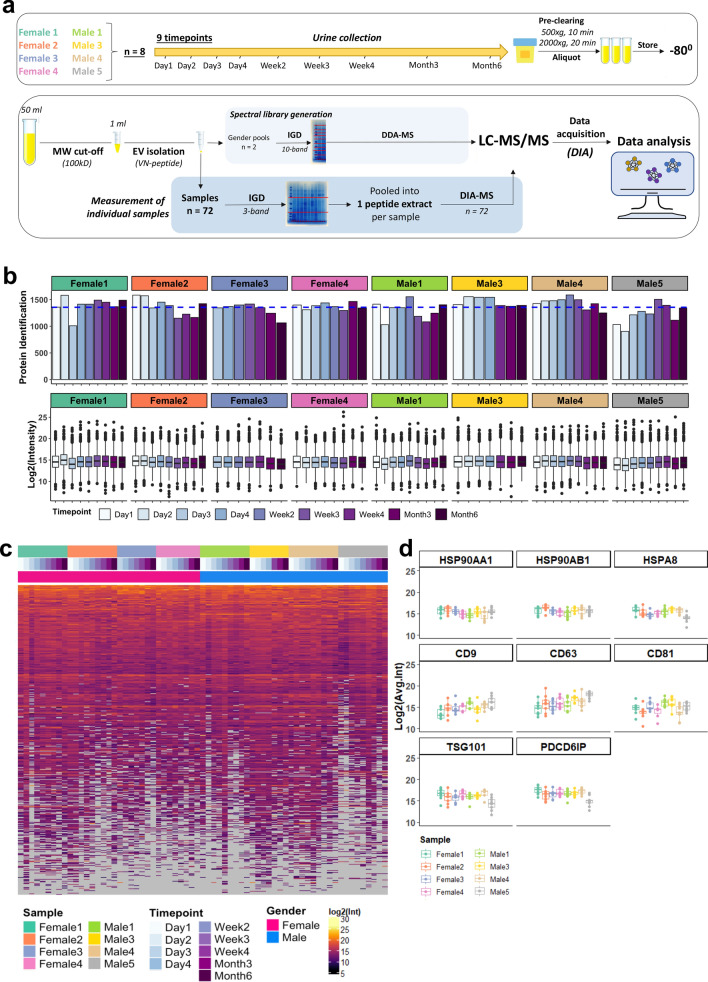
Figure 1.
Schematic workflow of the study and overview of the whole urinary EV proteome. (a) Schematic diagram of the collection of urine samples on the upper panel, and DIA-MS workflow on the lower panel. Urine was collected from 8 individuals at 9 timepoints over the course of 6 months (total 72 samples) and was pre-cleared from dead and apoptotic cells using centrifugation and stored at − 80 °C. 50 ml urine per donor was concentrated to 1 ml with ultrafiltration (100-kDa cut-off) and urinary EVs were subsequently isolated using the Vn96-peptide-affinity kit20. For the high-depth spectral library generation, gender-specific urinary EV pools (n = 2) were subjected to 10-band gel fractionation followed by DDA-MS. Individual samples (n = 72) were measured in single shot DIA-MS mode, followed by data extraction and quantification using intensities, and extensive data analyses. (b) Total number of proteins identified (upper panel) per individual sample and distribution of normalized protein intensities (lower panel) for each sample (n = 67), showing a highly similar protein identification number between the samples and individuals. (c) Data presence plot, showing a high data presence amongst all samples. The expression levels of the total urinary EV proteome (1802 proteins) is indicated amongst all samples (n = 67). The proteins were ranked according to data presence and average log2-intensity. The missing values (29,913 out of total 120,734 data points) are gray. (d) Expression levels of selected EV-related protein markers for each sample with Heat-shock proteins (upper panel), tetraspanins (middle panel), and TSG101 and PDCD6IP (lower panel) showing a good consistency in the level of these proteins in time.

