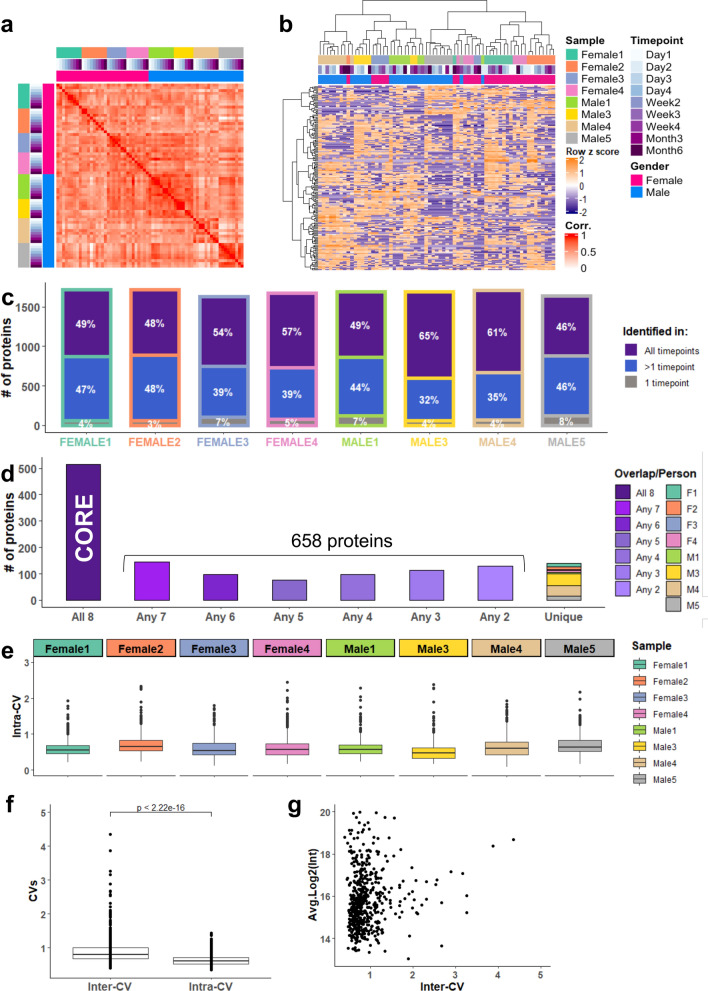
Figure 2.
Personal and inter-individual variation of the urinary EV proteome. (a) Unsupervised spearman correlation analysis of 8 individuals (67 samples) based on total proteome (1802 proteins) with the correlation coefficient values from 0 (white) to 1 (red). (b) Hierarchical clustering of the top 10% most variable urinary EV proteins (180 proteins) showing a clustering largely based on individual. (c) Number of proteins identified at all timepoints (purple), at more than 1 timepoint (blue) or at a single timepoint (gray) per donor. Percentages relative to the total proteins identified per person are annotated on the barplots. (d) Number of proteins identified in all individuals (core proteome, 516 proteins), in more than 1 individual (total 1174 proteins), and unique proteins per person (combined 113 proteins). (e) Distribution of personal CVs (intra-CVs) of each individual for the core urinary EV proteome (516 proteins) which was defined as the proteins detected at all timepoints in all 8 individuals. (f) Distribution of inter- and intra-CVs for the core urinary EV proteome (516 proteins). Inter-CV is calculated amongst 67 samples, and intra-CV is represented as the mean of the personal CVs of 8 individuals. (g) Distribution of inter-CVs in relation to protein abundance for the core urinary proteome (516 proteins), showing that the CV is independent from abundance.

