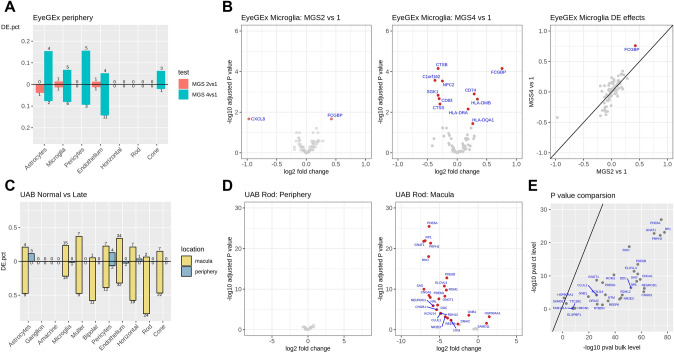
Figure 5.
Cell type-specific differential expression analysis in two datasets. (A) Proportions (y-axis) of up- and down-regulated ctDEGs detected in the EyeGEx peripheral retina data. Colors show different test conditions: red for MGS2 vs. MGS1, and green for MGS4 vs. MGS1. Numbers above each bar indicate the number of detected ctDEGs for each comparison. (B) Volcano plots and effect size comparison of microglia-specific DEGs detected in the EyeGEx peripheral retina data. Significant ctDEGs were colored in red and annotated with gene names. (C) Proportions (y-axis) of up- and down-regulated ctDEGs for control vs. advanced AMD comparison in the UAB bulk RNA-seq data. Colors show different retina regions: blue for periphery, and yellow for macula. Numbers above each bar indicate the number of detected ctDEGs for each comparison. (D) Volcano plots and effect size comparison of rod-specific DEGs identified for control vs. advanced AMD comparison in the UAB bulk RNA-seq data. Significant ctDEGs were colored in red and annotated with gene names. (E) Comparison of p-values for cell type level and bulk level differential expression analysis for control vs. advanced AMD comparison in the UAB bulk RNA-seq data in macula rod cells.

