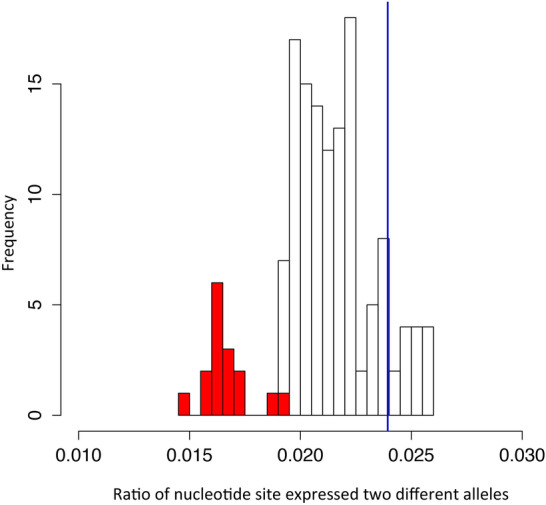
Figure 1.

Estimation of the probability of RNA-Seq data from hybrid species. The bars show the distribution of ratio of nucleotide sites expressing two different alleles (mixed site). Mixed RNA-Seq samples are generated by pair-wise mixing RNA-Seq data of 16 Flaveria species, which mimics the case of hybridization. The ratio of mixed site in the mixed RNA-Seq samples is showed in grey bars (positive control). The ratio of mixed site of 16 Flaveria species is showed in red bars (real causes). The ratio of hybrid sample F. pringlei*, was represented in blue vertical line.
