. 2021 Jun 25;38(2):205–218. doi: 10.5511/plantbiotechnology.21.0222a

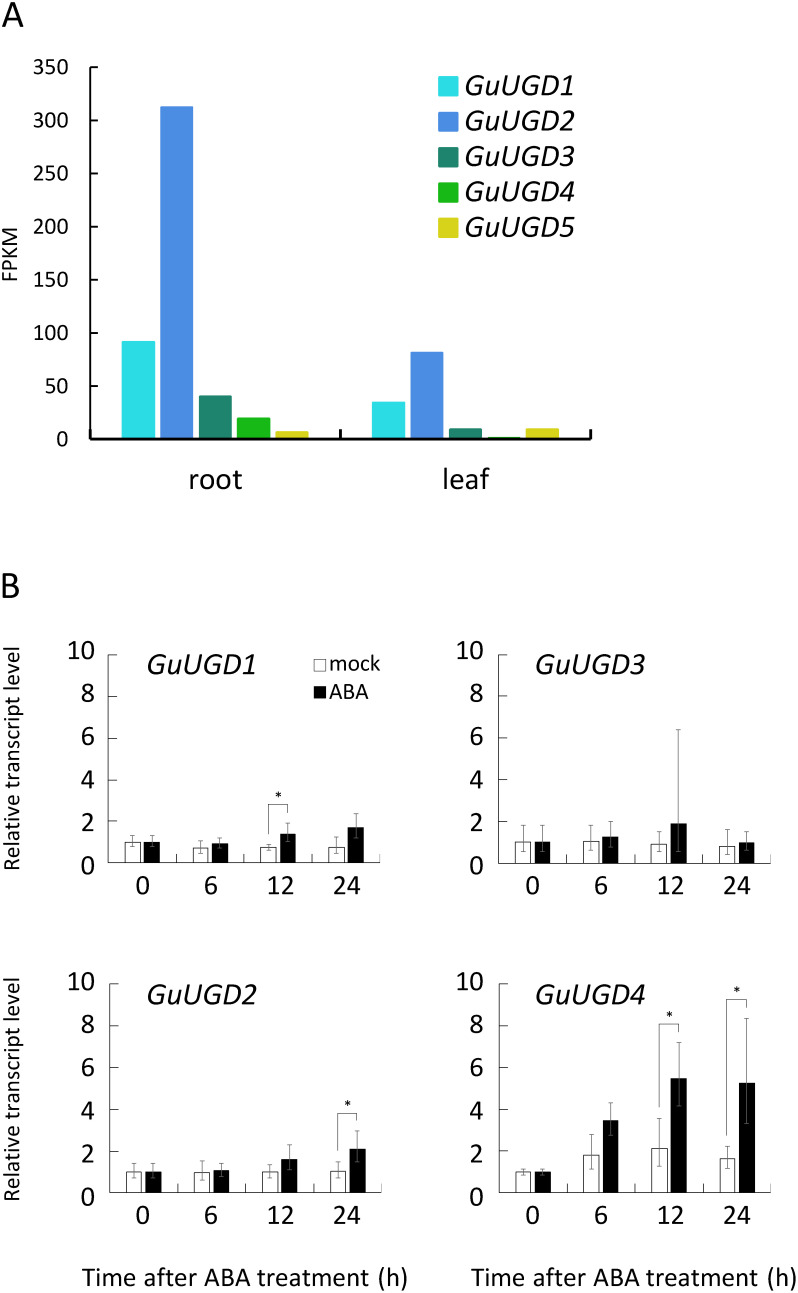
Figure 3. Expression patterns of GuUGD genes. (A) Tissue-specific expression of GuUGDs. Expression levels of GuUGDs are based on FPKM values obtained in RNA sequencing (RNA-Seq) analyses of G. uralensis plants (Ramilowski et al. 2013). (B) Quantitative polymerase chain reaction (qPCR) analyses of GuUGDs in abscisic acid (ABA)-treated cultured stolons. Transcript levels in tissue-cultured stolons treated with ABA are indicated by filled bars; outlined bars indicate the mock treatment. Relative transcript levels 0 h after treatment were set equal to 1. Error bars indicate the standard deviation (SD) of three biological replicates. Asterisks indicate significant differences in the gene expression level between the ABA and mock treatments at each time point. Student’s t test, *** p<0.001, ** p<0.01, * p<0.05.

Figure 3. Expression patterns of GuUGD genes. (A) Tissue-specific expression of GuUGDs. Expression levels of GuUGDs are based on FPKM values obtained in RNA sequencing (RNA-Seq) analyses of G. uralensis plants (Ramilowski et al. 2013). (B) Quantitative polymerase chain reaction (qPCR) analyses of GuUGDs in abscisic acid (ABA)-treated cultured stolons. Transcript levels in tissue-cultured stolons treated with ABA are indicated by filled bars; outlined bars indicate the mock treatment. Relative transcript levels 0 h after treatment were set equal to 1. Error bars indicate the standard deviation (SD) of three biological replicates. Asterisks indicate significant differences in the gene expression level between the ABA and mock treatments at each time point. Student’s t test, *** p<0.001, ** p<0.01, * p<0.05.