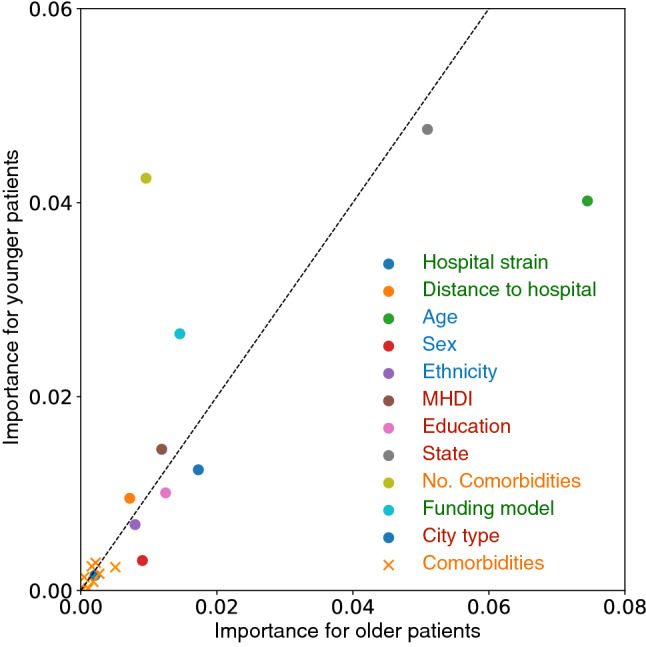
Figure 5.

Feature importance for older and younger patients. Each point represents a feature in the SIVEP-Gripe dataset, and the axes show the relative importance for COVID-19 mortality prediction for older (60 years, x axis) and younger ( years, y axis) hospitalized patients. Variables deviating from the dotted identity line suggests a different relative importance for the groups. The coloring marks the categories listed in Fig. 1.
