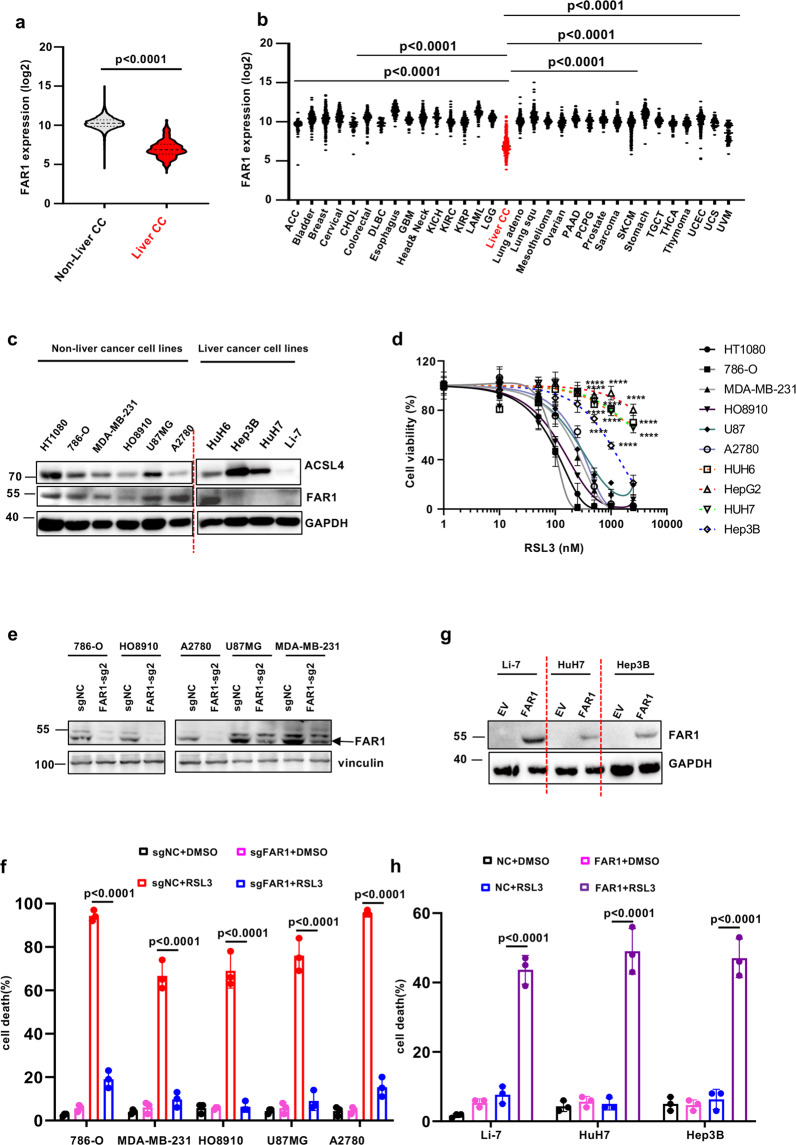
Fig. 4. FAR1 expression levels are positively correlated with ferroptosis response in a panel of cancer cell lines.
a FAR1 mRNA expression levels in liver carcinoma (liver-CC) and non-liver carcinoma tumor samples from TCGA RNA-Seq database. P values were calculated using two-tailed unpaired Student’s t-test. b FAR1 mRNA expression levels in a series of cancer types from TCGA RNA-Seq database. c Western blot analysis of a panel of cancer cell lines. The Western blot experiments were repeated twice, independently, with similar results. d Dose-dependent toxicity of RSL-3 induced cell death in a panel of cancer cell lines. Cell viability was assessed 24 h thereafter using CCK8. e Western blot analysis of cancer cell lines expressing sg-ctrl or sg-FAR1. The Western blot experiments were repeated twice, independently, with similar results. f Cell death of cancer cell lines expressing sg-ctrl or sg-FAR1 treated with RSL3. g Western blot analysis of liver cancer cell lines over-expressing FAR1. The Western blot experiments were repeated twice, independently, with similar results. h Cell death of liver cancer cell lines over-expressing FAR1 treated with RSL3. Data and error bars are mean ± s.d., n = 3 (d, h) independent repeats. All P values were calculated using two-tailed unpaired Student’s t-test.

