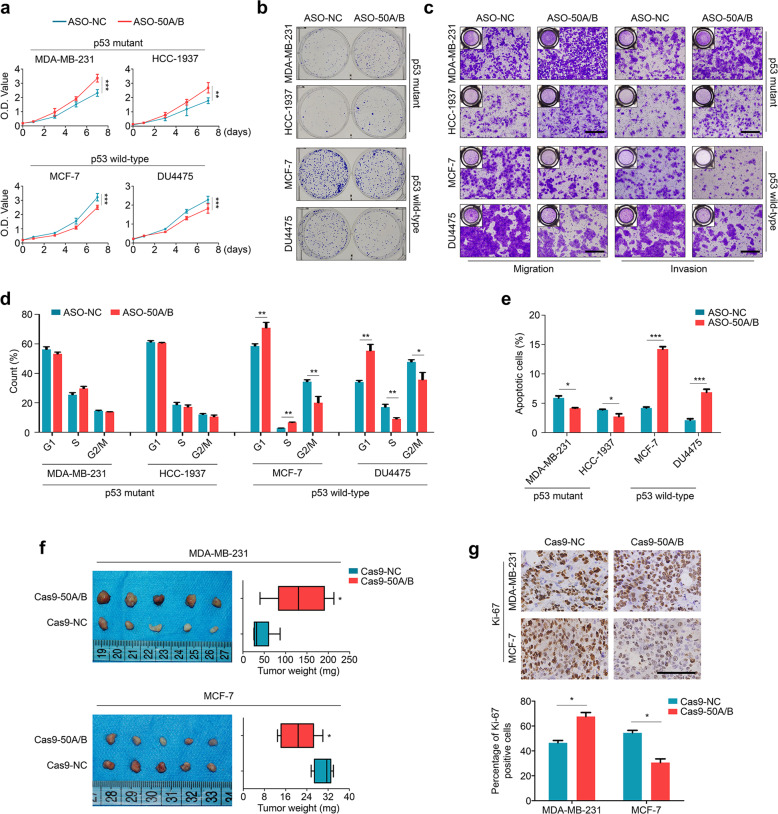
Fig. 2. Distinct roles of SNORD50A/B knockdown or knockout in p53mt and p53wt breast cancer cells.
a The effect of SNORD50A/B knockdown on the proliferation of the indicated cells was assessed by MTT assay. b The effect of SNORD50A/B knockdown on colony formation ability of the indicated cells. Shown are representative images of colony formation. c The effects of SNORD50A/B knockdown on migration and invasion potential of the indicated cells were evaluated by Transwell assays. Shown are representative images of migrating/invading cells. d The effect of SNORD50A/B knockdown on cell cycle distributions in the indicated cells. e The effect of SNORD50A/B knockdown on the apoptosis of the indicated cells. f Representative images of the indicated xenograft tumors and statistical analysis of tumor weight. g The levels of Ki-67 proteins in the indicated xenograft tumors by IHC assay (upper panels). Statistical analysis of the percentage of Ki-67 positive cells was shown in lower panels. Data were presented as mean ± SD. Scale bars, 200 µm. NC, negative control; 50 A/B, SNORD50A/B; *, P < 0.05; **, P < 0.01; ***, P < 0.001.

