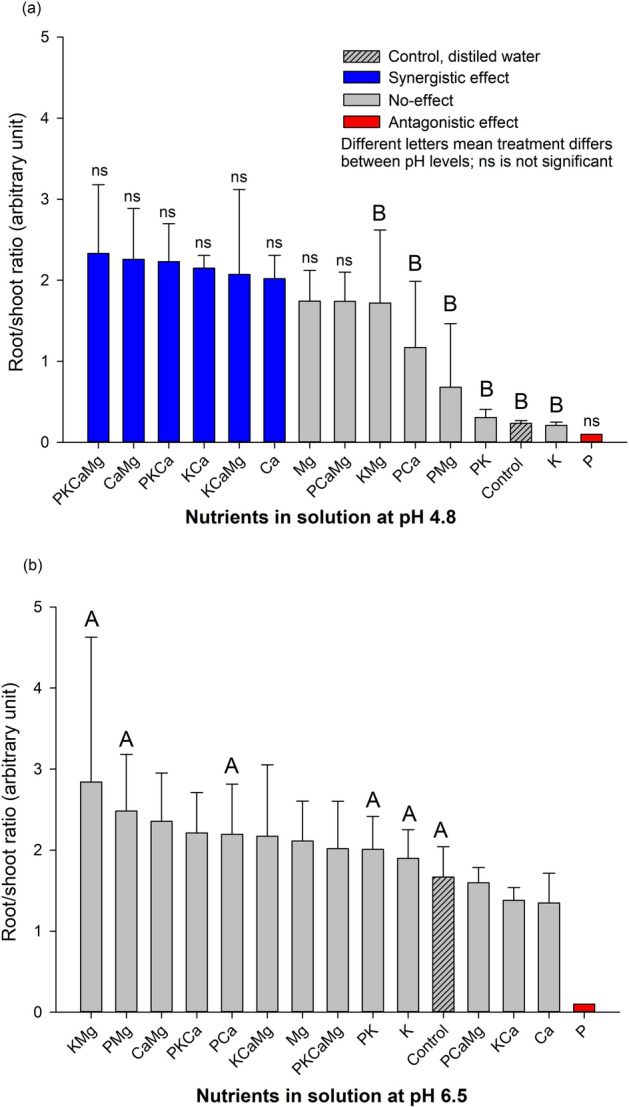
Figure 5.

Root:seedling ratio (RSR) of Conyza canadensis in response to the nutrients (alone or in combination) under solutions at pH 4.8 (a) and at pH 6.5 (b). Bars with the different colours, comparing means among treatments, are significantly different, according to the Tukey’ test (p < 0.05). Different letters represent a statistical difference for the same treatment between the two pH tested while ns represents not significant; The results in the Bars represent means, while error bar marks represent standard deviation (n = 4) from the mean value.
