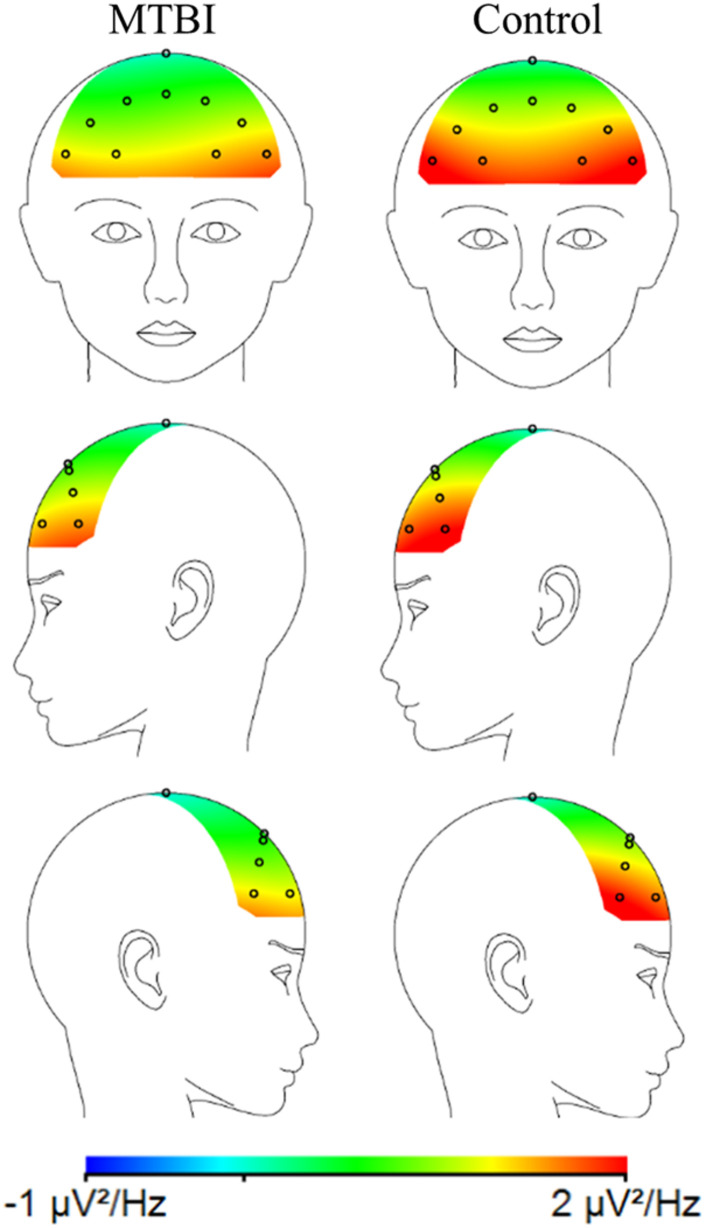
FIGURE 2.
A topographic plot illustrating the average alpha power (μV2/Hz) for the MTBI group (on the left) and the Control group (on the right) in the frontal electrodes. The MTBI group had relatively more negative FAA (lnF4-lnF3) than the Control group, i.e., relatively less alpha power on the right (F4) than left frontal (F3) electrodes. This is thought to indicate greater cortical activity on the right compared to the left frontal region.

