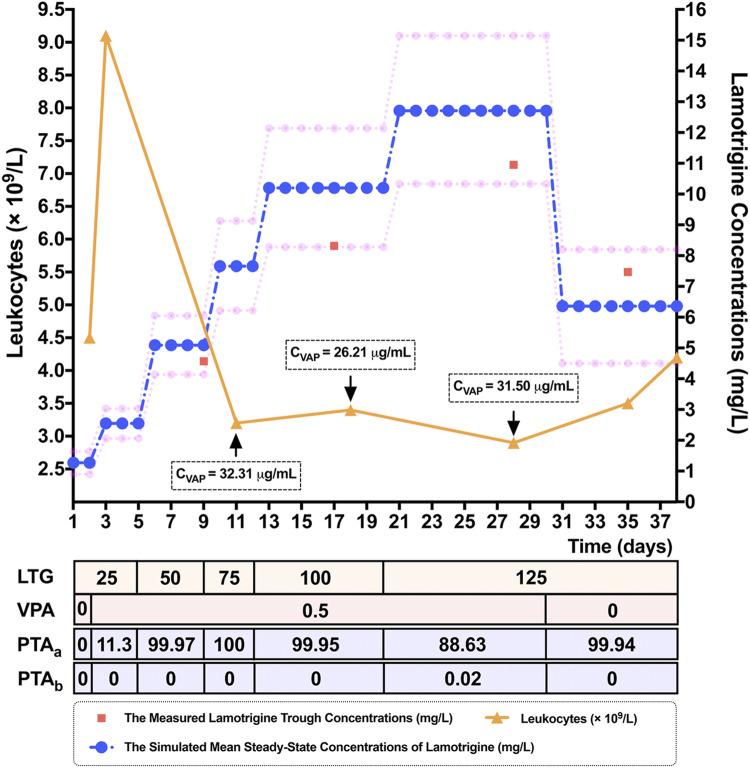
FIGURE 3.
Simulated mean steady-state concentrations (C ss) (represented by blue dots) and the corresponding 10th and 90th percentiles (represented by pink dots), of the response to lamotrigine (LTG) for dosing regimens of 25 mg/bid to 125 mg/bid by adolescent Chinese patients with epilepsy weighing 60 kg in a 10,000-virtual patient Monte Carlo (MC) simulation. The 80% prediction interval, encompassing 80% of the simulated sample, adequately captured the measured LTG concentrations (represented by red squares) of a 15-year-old female epileptic Chinese patient weighing 60 kg. The patient’s leukocytes (represented by orange triangles) decreased when the LTG concentration was increased, and had normalized when she was discharged. Note. LTG: the dosing titration regimens of LTG (mg/bid), VPA: the dosing titration regimens of the co-administered valproate acid (VPA) (g/qd), CVPA: the measured trough concentrations of VPA, PTAa: the probability of target attainment values (%) needed to reach C ss within the range of 3–15 mg/L, PTAb: the probability of target attainment values (%) needed to reach C ss ≥ 20 mg/L.

