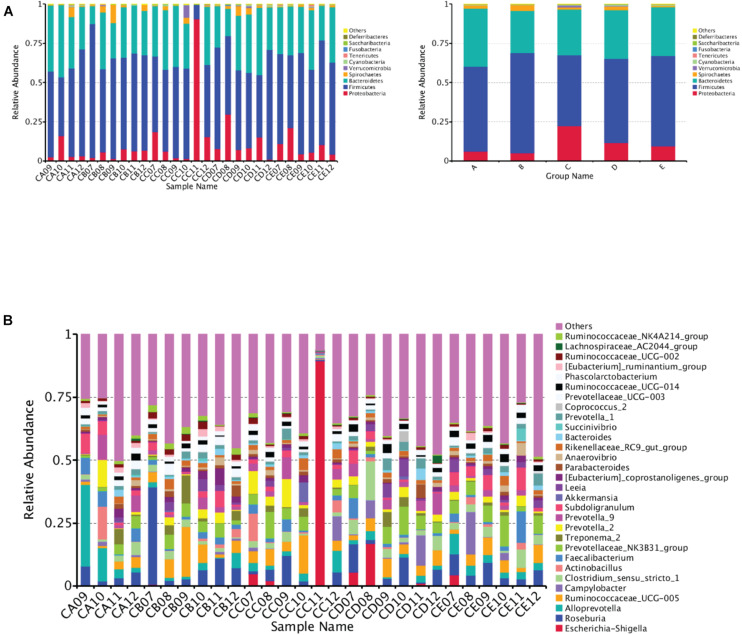
FIGURE 3.
Bar graph showing the top 10 (A) or top 30 (B) phylum level compositions of bacteria. Color-coded bar plot showing the relative abundance of bacterial phyla across the different samples (A, left) or different groups (A, right). One representative sequence from a set of related sequences belonging to the same OUT was selected for continuous species annotation with an RDP classifier, and the bacterial composition at the phylum level of each sample was stated and visualized with a histogram. The first C representing it comes from the cecal chyme. The second character represented DAR. DARs of A, B, C, D, and E were 0.00, 0.20, 0.40,0.60, and 0.80, respectively.

