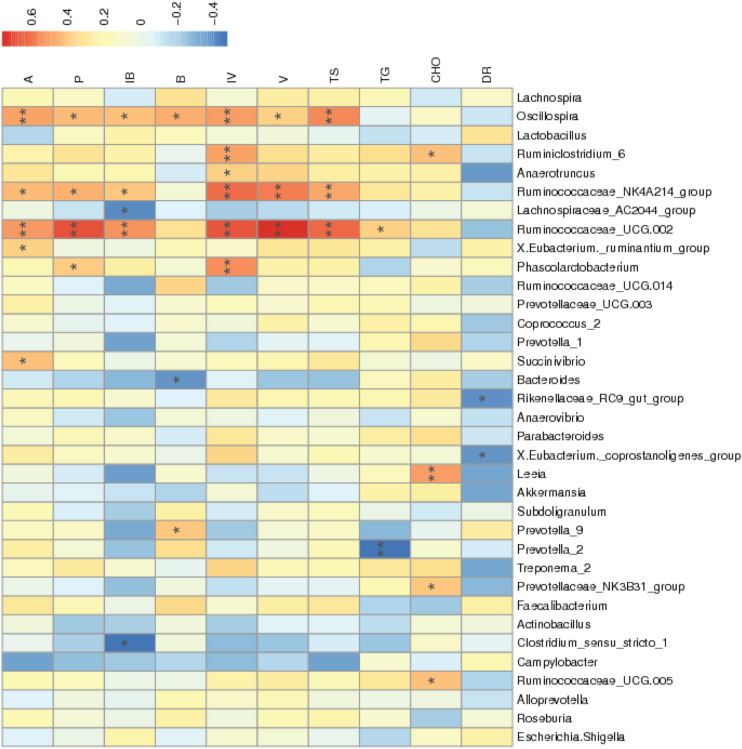
FIGURE 4.
Correlation of the environment and abundance of bacteria at the genus level. Species information is arranged in rows, and environment factors are arranged vertically and are on the horizontal axis (x-axis). Different colors indicate the relative abundance between species and environment factors; r < 0 represented a negative correlation, and r > 0 represented a positive correlation. *Means P < 0.05. **Means P < 0.01. A, acetic acid; P, propionic acid; IB, isobutyric acid; B, butyric acid; IV, isovaleric acid; V, valeric acid; TS, total amount of SCFA; TG, triglyceride; CHO, cholesterol; DR, diarrhea rate during the third week.

