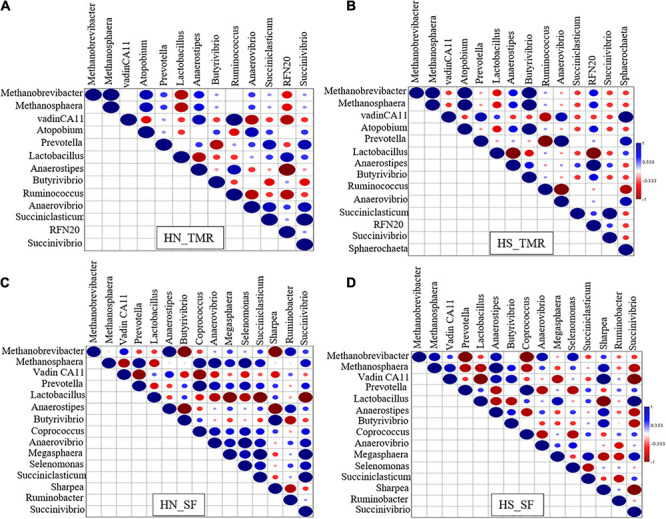
FIGURE 4.

Kendall rank correlation analysis of the co-occurrences of microbial lineages. (A) Hanwoo (HN) steers fed a total mixed ration (TMR) diet. (B) Holstein (HS) steers given TMR diet. (C) Hanwoo (HN) steers given separate feed (SF) diet. (D) Holstein (HS) steers given SF diet. The genera were included in the matrix if they had a relative abundance of at least 0.01% in at least one steer. Correlation strength is indicated by the intensity of the colour. The scale colours denote whether the correlation is positive (closer to 1, blue Spheres) or negative (closer to −1, red Spheres). Big sphere indicates that the correlation is significant (P < 0.05).
