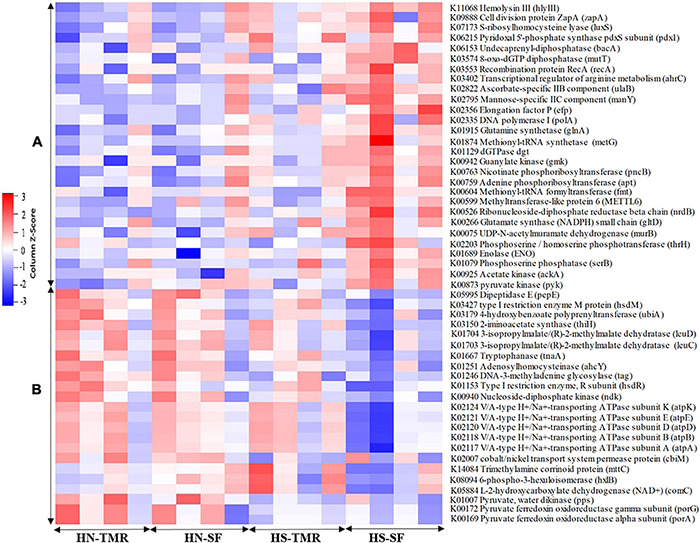
FIGURE 7.

Heatmap of the relative abundance of microbial genes negatively (A) and positively (B) associated with methane production, as identified by Kendall rank correlation analysis. The scale colours denote whether the abundance is high (closer to 1, red squares) or low (closer to −1, blue squares).
