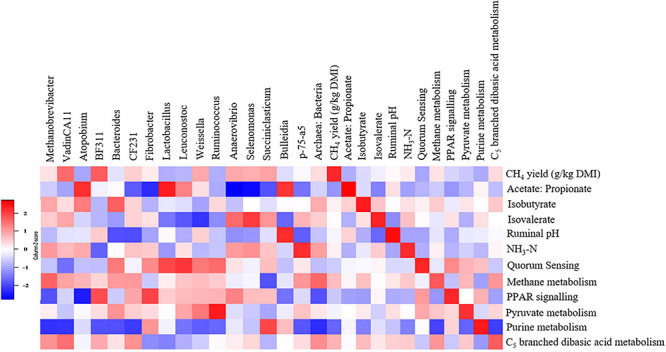
FIGURE 9.

Associations among methane yield, fermentation parameters, rumen microbes, and metabolic pathways in steers. The genera and metabolic pathways were included in the matrix if they were differentially abundant (P < 0.1) and had at least 0.01% relative abundance in at least one of the steers. Correlation strength is indicated by the intensity of the colour. The scale colours denote whether the correlation is positive (closer to 1, red squares) or negative (closer to −1, blue squares).
