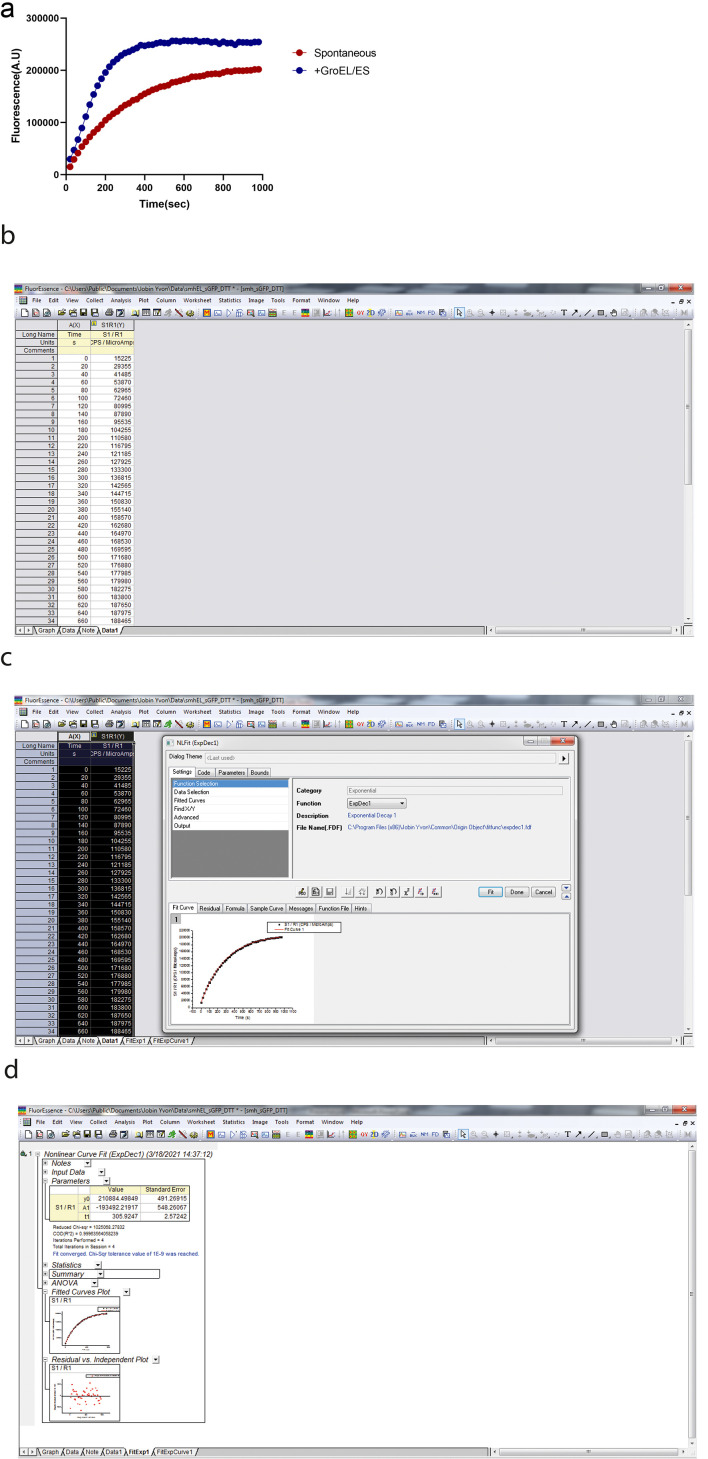
Figure 1. sGFP refolding plot.
a. Plot showing the kinetics of sGFP refolding as measured by an increase in GFP fluorescence. sGFP was unfolded in 6 M GuHCl in Buffer A at 25°C for 1 h. Subsequently, unfolded sGFP was refolded by 100-fold dilution in Buffer A. b. The output screen after refolding. c. This screen appears by clicking on analysis after selecting the columns for time and fluorescence. d. This screen appears after the fitting by selecting ‘expdec1’ in the function section.

