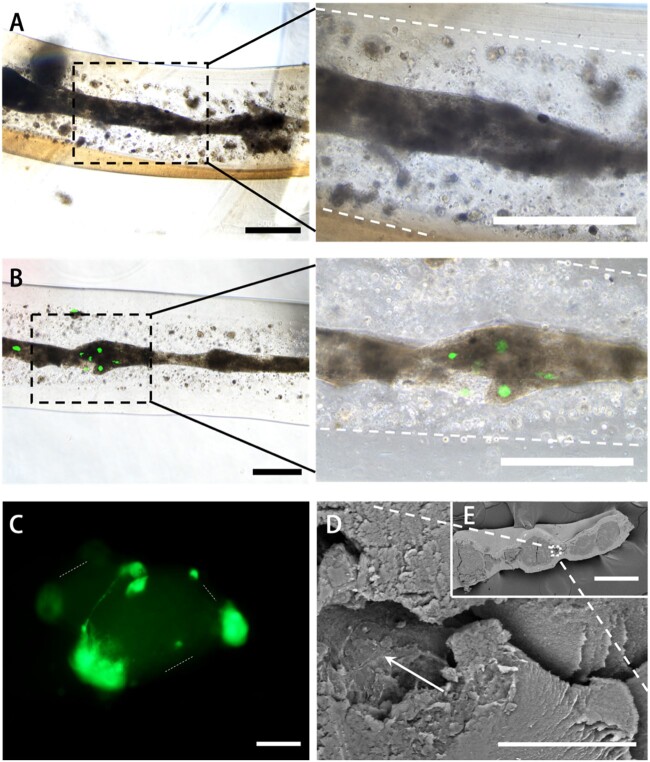
Figure 3.
Observation of bioprinted constructs. (A) The BMMSC-induced growth observation images after 14 days where the boundary between the shell and core was marked out with white dotted line (scale bar: 500 μm). (B) The BMMSC-induced and NSCs co-culture growth observation images after 14 days in which the green fluoresce presents NSCs and the boundary of BMMSC cluster was marked out with white dotted line (scale bar: 500 μm). (C) NSC fluoresce observation image in 3D co-culture construct where the boundary between the shell and core was marked out with white dotted line (scale bar: 100 μm). (D–E) SEM images, white arrow indicated filamented cell cluster (scale bar: 30 μm for D, 300 μm for E)

