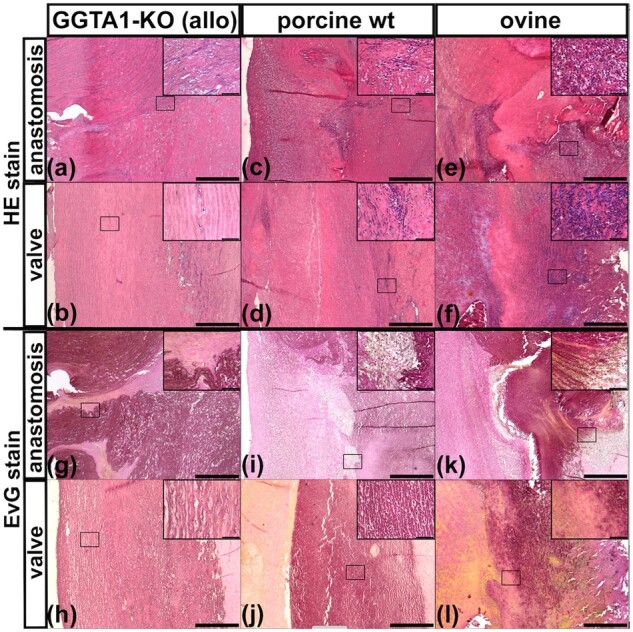
Figure 2.

Histology of explanted aortic bypasses after 3 months in vivo. (a–f) H&E staining to visualize cells and (g–l) Elastica van gieson (EvG) staining to visualize elastic fibers and other ECM components. Position of figure depicted in inserts is marked by a black rectangle. Cuts made from graft to recipient anastomosis (anastomosis) and of the graft at the level of the former aortic valve (valve) have been stained and are depicted here. (a, b, g, h) Porcine graft derived from GGTA1-KO pig. (c, d, i, j) Porcine graft derived from wt pig. (e, f, k, l) Ovine xenogeneic graft derived from sheep. Scale bars are 500 µm and 50 µm for inserts.
