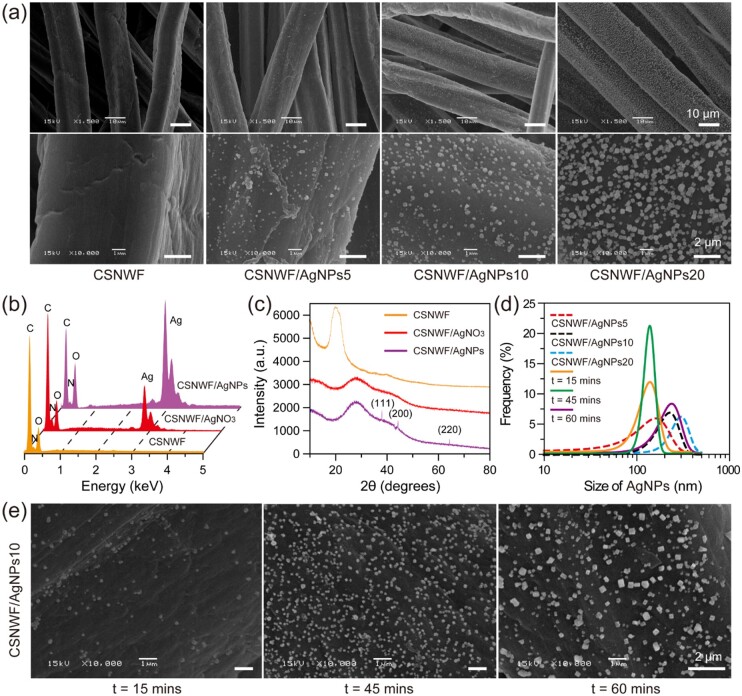
Figure 1.
(a) Scanning electron microscope (SEM) images of original and AgNPs anchored fibers of CSNWF. Groups of CSNWF/AgNPs5, CSNWF/AgNPs10 and CSNWF/AgNPs20 represented the CSNWF were treated by the AgNO3 solution at the concentration of 5, 10 and 20 mM, respectively. The UV irradiation time was 30 min. (b) EDS and (c) XRD characterization. (d) The size distribution of AgNPs in different conditions. (e) SEM images of the CSNWF/AgNPs10 group with different duration of UV irradiation

