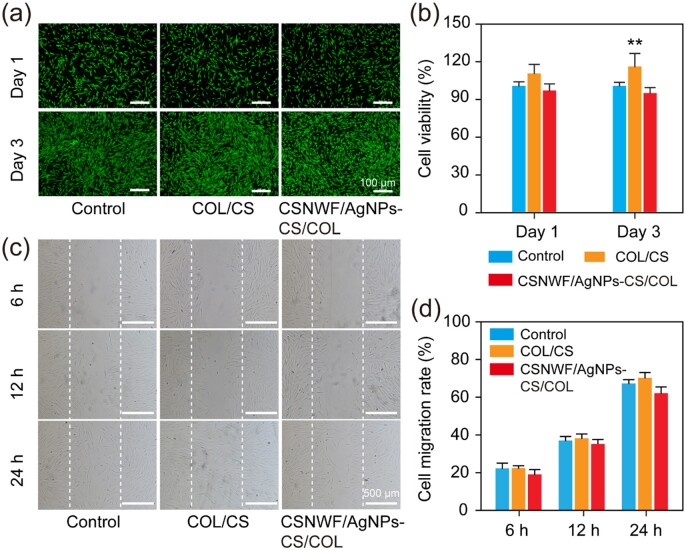
Figure 5.
In vitro biocompatibility and wound healing evaluation of composite wound dressings. (a) Fluorescence images of HSF cells after live/dead staining. Green fluorescence presented living cells, and the red fluorescence indicates dead cells. (b) The proliferation of HSF cells versus different culture times by WST-1 assay. The optical density value of the control group on Day 1 was denoted as the viability of 100%. (c) Representative images of HSF cells migration into the ‘wound gap’. (d) Cell migration rates. The control group was the cells seeded in the normal cell culture medium (**P < 0.01 versus the control group)

