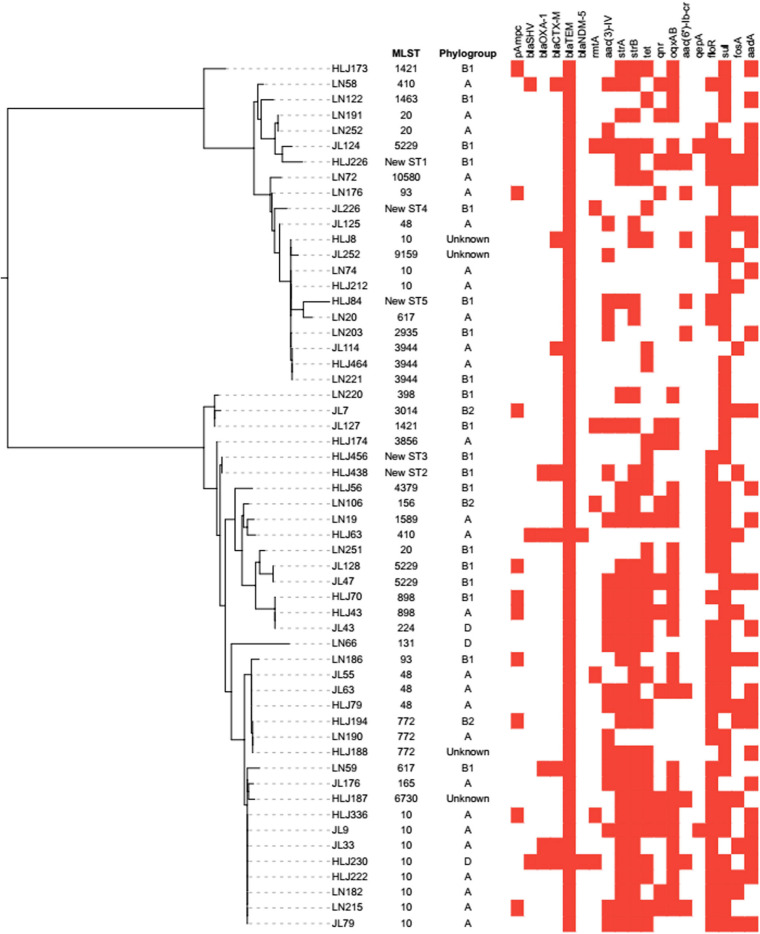
FIGURE 2.
Analysis of phylogroup, antimicrobial resistance genes, and relationships among 56 mcr-1-positive E. coli isolates from swine farms in northeastern China. Relationships among 56 mcr-1-positive E. coli isolates are indicated using an unrooted tree based on the alignments of concatenated MLST allelic sequences using the neighbor-joining method. For comparison of resistance genes among the 56 mcr-1-positive E. coli isolates, the red squares represent positivity for antimicrobial resistance genes.

