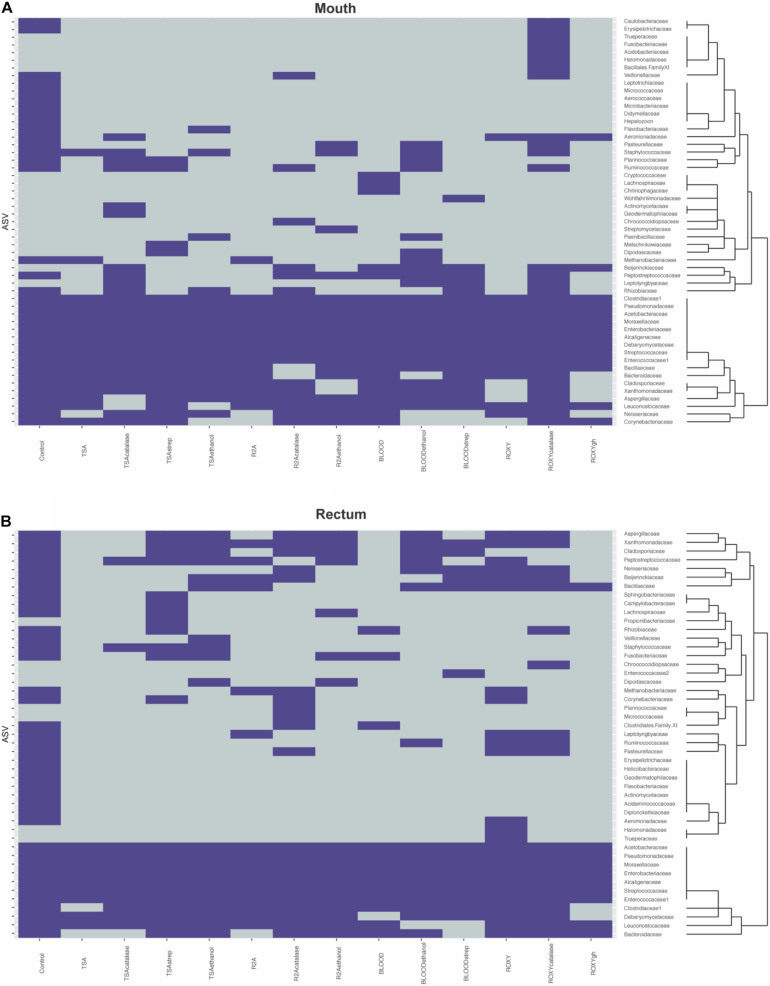
FIGURE 4.
Heatmaps describing presence absence of taxonomic families observed in the (A) mouth and (B) rectum. Purple indicates that a family was observed while gray indicates that a family was absent. The dendrograms highlight clusters of families observed during cultivation. Control refers to the families identified on the molecular control.

