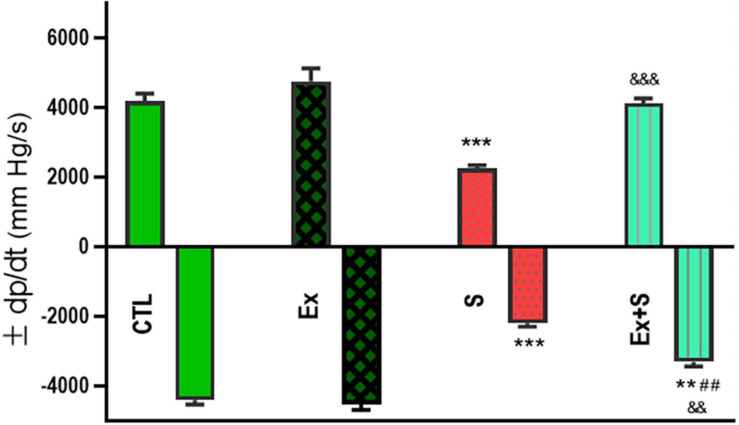
FIGURE 3.
Effects of waterpipe smoke inhalation on positive dP/dt max (+dP/dt max) and negative dP/dt max (-dP/dt max) in experimental groups. CTL, control group; Ex, group subjected to exercise training for 8 weeks; S, group subjected to waterpipe tobacco smoke inhalation for 8 weeks; Ex + S, group subjected to exercise training and waterpipe tobacco smoke inhalation for 8 weeks. The results are presented as mean ± SEM, n = 7. **P < 0.01; ***P < 0.001 vs. CTL; ##P < 0.01 vs. S; &&P < 0.01; &&&P < 0.001 vs. Ex.

