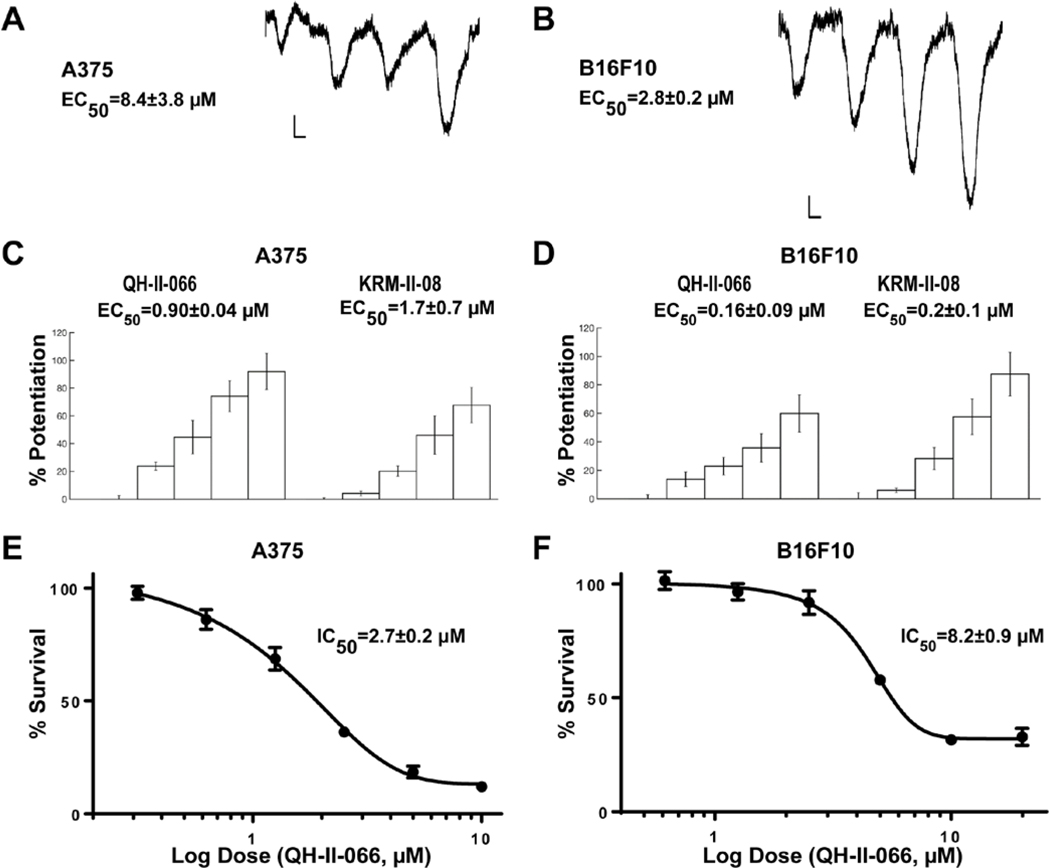
Figure 2. Characterization of melanoma GABAA receptors.
Representative electrophysiology recordings of transmembrane anion flow in human melanoma line A375 (A) and mouse melanoma line B16F10-GP (B) in response to GABA (1, 3, 10, 30 μM). Horizontal calibration bars, 2 seconds; vertical bars, 500 pA; sweeps are ensemble recordings from 8 electrodes. Potentiation of GABA responses in A375 (C) and B16F10-GP (D) cells in response to benzodiazepines (QH-II-066 and KRM-II-08 at 0, 0.3, 1, 3, 10 μM). GABA concentration was 1 μM. In vitro MTS assay of A375 (E) and B16F10-GP (F) cells in response to QH-II-066.

