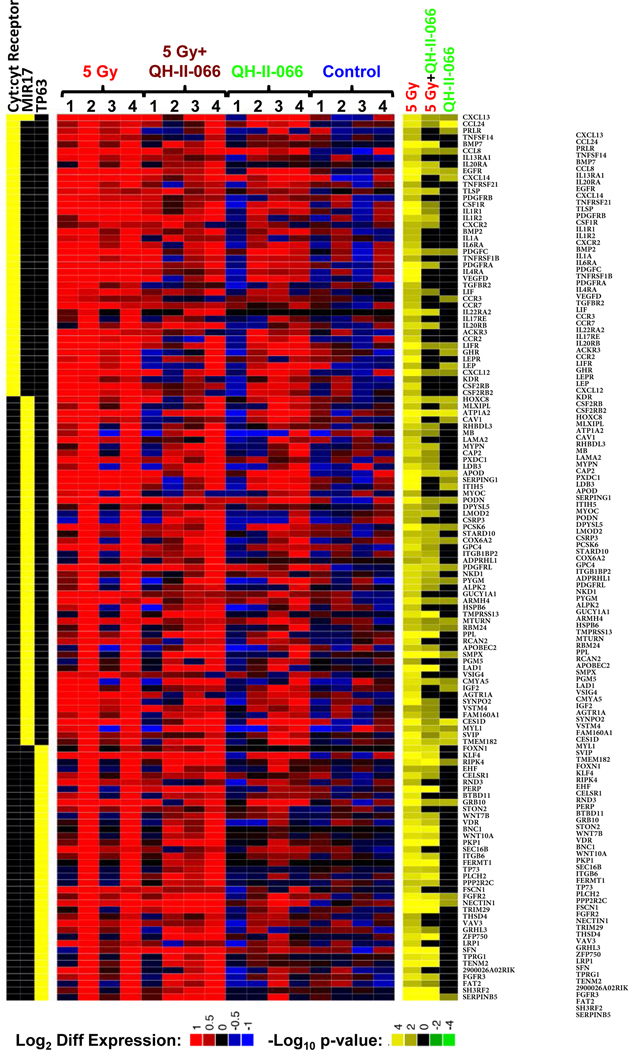
Figure 4. Differential gene expression in treated mouse tumors.
Expression levels of differentially expressed genes in enriched immunity-related KEGG pathway (cyt:cyt Receptor is abbreviation for cytokine:cytokine receptor), p63 target genes, and enhanced expression of genes associated with overexpression of microRNA mir-17, identified by enrichment analysis of the ImmuneSigDB compendium of transcriptional immune signatures.26, 48, 49 Genes in the enriched gene sets were considered to be differentially expressed if edgeR FDR<0.05 in any one of the 3 comparisons. Left, heatmap indicates membership of each gene (rows) in the enriched gene sets (columns). Middle, heatmap displays expression levels of genes in individual samples (columns) in terms of log2 counts per million (LCPM).50 Each LCPM has been normalized by subtracting the gene-specific average LCPM of the untreated samples. Right, heatmap displays statistical significance and the direction of the change in each of the comparisons made (5 Gy vs Control; 5 Gy+QH-II-066 vs Control; QH-II-066 vs Control) (columns), each vs control. The statistical significance is expressed in log10(p-value) when expression ratio was less than 1 (down-regulation) and -log10(p-value) when expression ratio was greater than 1 (up-regulation) resulting in negative numbers for downregulation and positive for upregulation. Abbreviation: FDR, false discovery rate.

