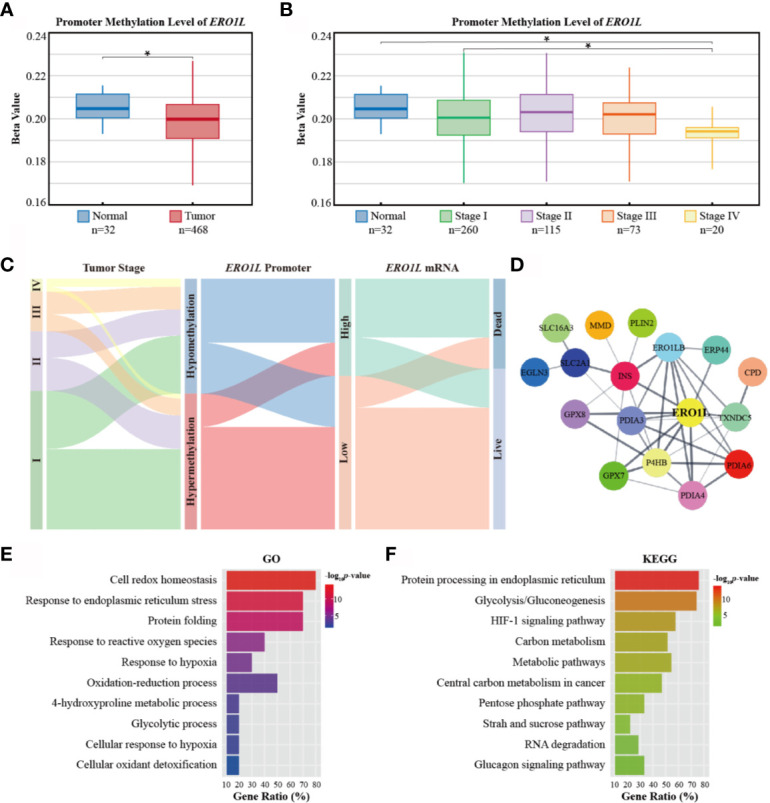
Figure 3.

Promoter methylation of ERO1L and functional annotation of the ERO1L co-expression module. (A, B) Analysis of ERO1L methylation in the TCGA database. Promoter methylation levels of ERO1L in tumor and normal tissues (A) according to tumor stage (B). (C) Path analysis in patients with LUAD across tumor stage, promoter methylation, mRNA expression, and survival status. The line represents the group; the width of the lines represents the number of patients transferred from one state to another (n=468). (D) PPI networks of the ERO1L co-expression module. (E, F) Functional annotation and pathway enrichment of the ERO1L co-expression module. Top 10 terms of GO annotation (E) and KEGG pathway (F). *p < 0.05.
