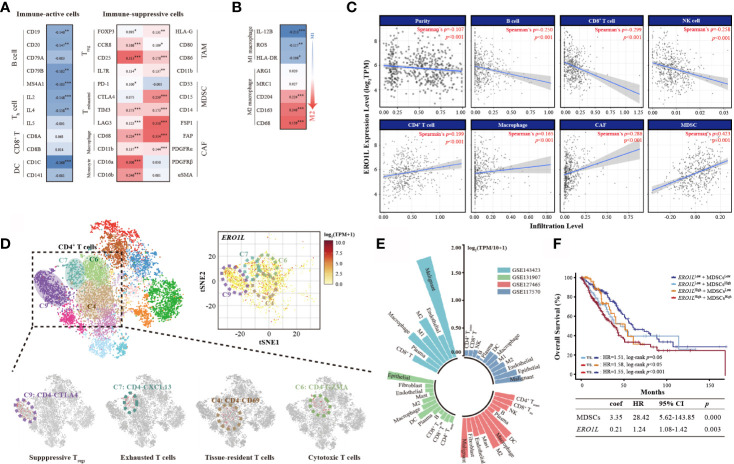
Figure 4.
Overexpression of ERO1L shapes an immune-suppressive tumor microenvironment. (A) Correlations between ERO1L and the immune cell markers. (B) ERO1L expression correlates with macrophages polarization. (C) ERO1L expression was significantly negatively correlated with infiltrating levels of B cells, CD8+ T cells, and NK cells and significantly positively correlated with infiltrating levels of CD4+ T cells, macrophages, CAFs, and MDSCs. (D) The intrinsic heterogeneity of CD4+ T cells according to ERO1L expression as determined via single-cell sequencing data. Each dot corresponds to a single cell and is colored according to the cell cluster. The color density indicates the expression of ERO1L. (E) Summary of four single-cell sequencing datasets according to correlations with ERO1L. Different datasets are labeled in different colors. (F) The Cox proportional hazards model is constructed according to expressions of ERO1L and MDSC. *p < 0.05; **p < 0.01; ***p < 0.001.

